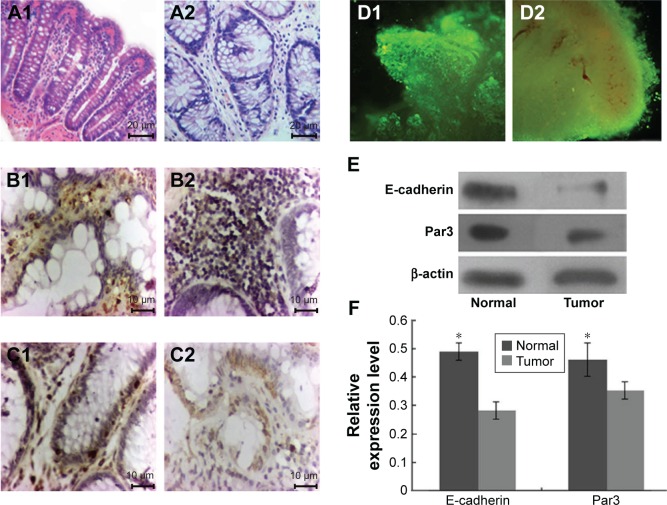
Figure 2.
Immunohistochemistry, Western blotting and qRT-PCR of E-cadherin and Par3.
Notes: (A1 and A2) H&E staining of normal and tumor tissue (×200). (B1 and B2) Immunohistochemical staining of E-cadherin between normal and tumor tissues (×400). (C1 and C2) Immunohistochemical staining of Par3 between normal and tumor tissues (×400). (D1 and D2) Calcein-AM/PI staining of cultured tissue for 3 and 25 days (×40). (E) Western blotting of E-cadherin and Par3 between normal and tumor tissues. (F) Expression level of E-cadherin and Par3 analyzed by Western blotting. *Denotes statistical significance compared with normal tissues.
Abbreviations: H&E, hematoxylin and eosin; PI, propidium iodide; AM, acetoxymethyl ester.

