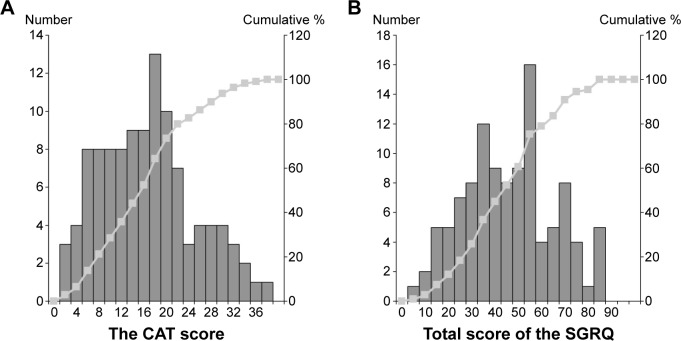
Figure 1.
Frequency distribution histograms and cumulative frequency distribution curves of CAT (A) and SGRQ (B) total scores in 109 consecutive subjects with stable COPD.
Notes: The bars show the frequency distribution for each score. Line plots indicate the cumulative percentage of patients.
Abbreviations: CAT, COPD assessment test; COPD, chronic obstructive pulmonary disease; SGRQ, St George’s Respiratory Questionnaire.

