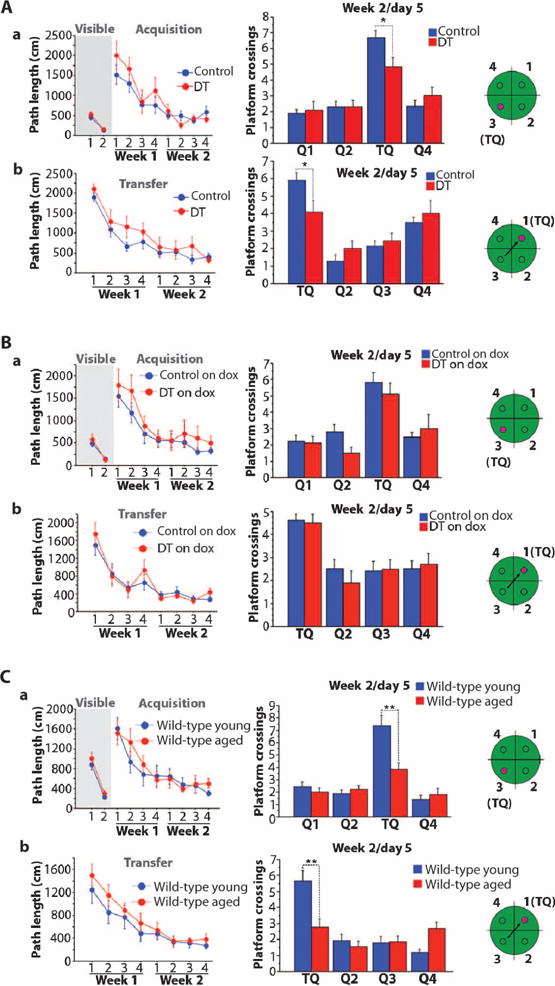
Fig. 4. Effect of RbAp48-DN in the adult forebrain on spatial memory.

Mice tested in the Morris water maze. (Left) Path lengths (mean ± SEM) for mice to reach the platform over the days of training. (Right) Number of platform crossings (mean ± SEM) during probe trials 1 day after the end of training. In the probe trial, the platform was removed from the pool and the mice swam for 1 min. The number of times that the mice cross the platform location in the training quadrant (TQ; the quadrant of the pool where the platform was during training) indicates the strength of their spatial memory. (a) Visible and hidden platform versions of the task. (b) Transfer phase of the task (the mice are trained to learn a new hidden platform location). The green schematics depict the quadrants of the pool, and the small circle in them depicts the platform locations. (A) DT and control mice kept off doxycycline in adulthood [same mice as in Fig. 3A (a); DT: n = 11 and control: n = 22 (tetO = 6, tTA = 8, WT = 8); one experiment]. No differences were observed between DT and controls [P > 0.137, repeated-measures ANOVA for visible (a), hidden/acquisition (a), and hidden/transfer (b)]. In the probe trials (right), DT displayed significantly lower performance than did controls [repeated-measures ANOVA, quadrant × genotype effect: P = 0.04 (a) and P = 0.03 (b); t test in training quadrant: P = 0.017 (a) and P = 0.035 (b)]. (B) DT and control groups treated with doxycycline in adulthood [same mice as in Fig. 3B (a); DT on dox: n = 10 and control: n = 17 (tetO = 5, tTA = 5, WT = 7); one experiment]. No differences were observed (repeated-measures ANOVA; visible/hidden-acquisition/hidden-transfer: P > 0.16; probe trials: P > 0.34). (C) Young adult (3.5 months) and aged (15 months) WT mice (n = 14 per age; one experiment). Groups showed similar path lengths during training [P > 0.1, repeated-measures ANOVA for (a) and (b)]. During the probe trials, aged mice crossed the platform location significantly less often than did young animals [repeated-measures ANOVA, age × quadrant effect: P = 0.0003 (a) and P = 0.0002 (b); t test for training quadrant: P = 0.0015 (a) and P = 0.002 (b)]. *P < 0.036; **P < 0.0021. See table S3 for detailed analysis.
