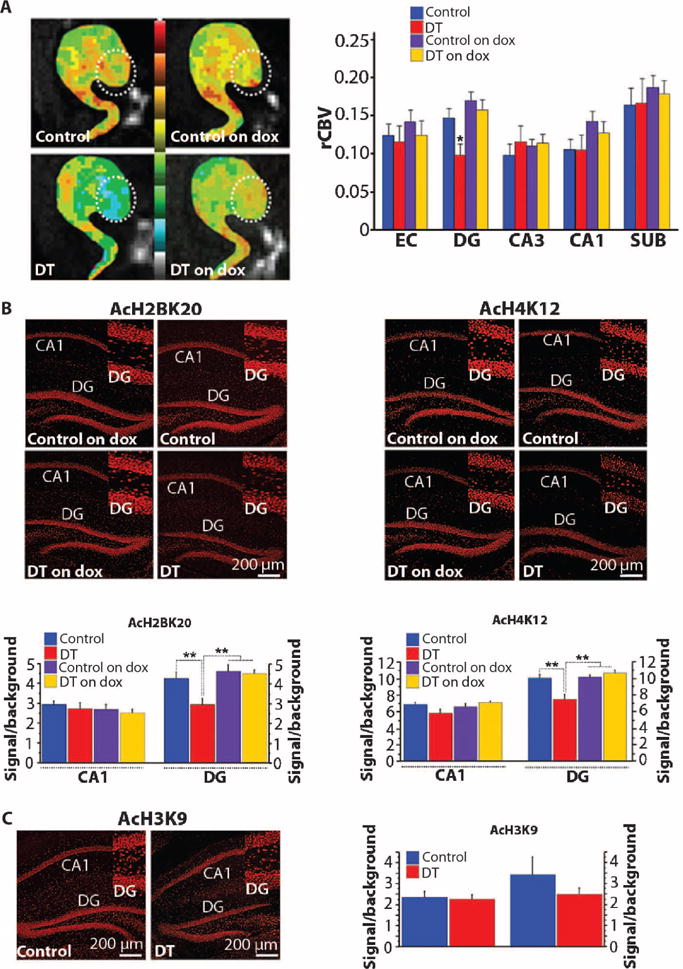
Fig. 5. RbAp48-DN in the DG.

(A) (Left) Individual examples of CBV maps of the hippocampal formation [EC, DG (circle), CA3-CA1, and subiculum (SUB)], generated with MRI, in DT mice on or off dox in adulthood and respective control siblings. The CBV maps are color-coded such that cooler colors reflect less basal metabolism. (Right) Group data analysis (mean ± SEM) of relative CBV (rCBV) (DT off dox: n = 9, controls off dox: n = 19, DT on dox: n = 12, controls on dox: n = 15; one measure per subregion per mouse). Selective decrease in rCBV of DG in DT off dox (F = 6.3, P = 0.019). (B) Immunohistochemistry (top) and quantification (mean ± SEM) (bottom) of AcH2B(Lys20) and AcH4(Lys12). Their levels were significantly reduced in the DG of DT off dox (comparisons with controls off dox and controls and DT on dox; P < 0.003, ANOVA). AcH2B(Lys20): DT off dox: n = 27 slices (five mice), DT on dox: n = 15 slices (three mice), controls off dox: n = 45 slices (seven mice), controls on dox: n = 15 slices (four mice). AcH4(Lys12): DT off dox: n = 44 slices (five mice), DT on dox: n = 15 slices (three mice), controls off dox: n = 52 slices (seven mice), controls on dox: n = 11 slices (four mice). (C) Immunohistochemistry (left) and quantification (mean ± SEM) (right) of AcH3(Lys9). No differences were observed (P > 0.42, ANOVA). DT off dox: n = 16 slices (five mice), controls off dox: n = 28 slices (seven mice). Mice on dox were not analyzed because no difference was detected in mice off dox. (Insets) High-magnification DG images. (B and C) See tables S1 and S3 for detailed analysis. *P < 0.05; **P < 0.01.
