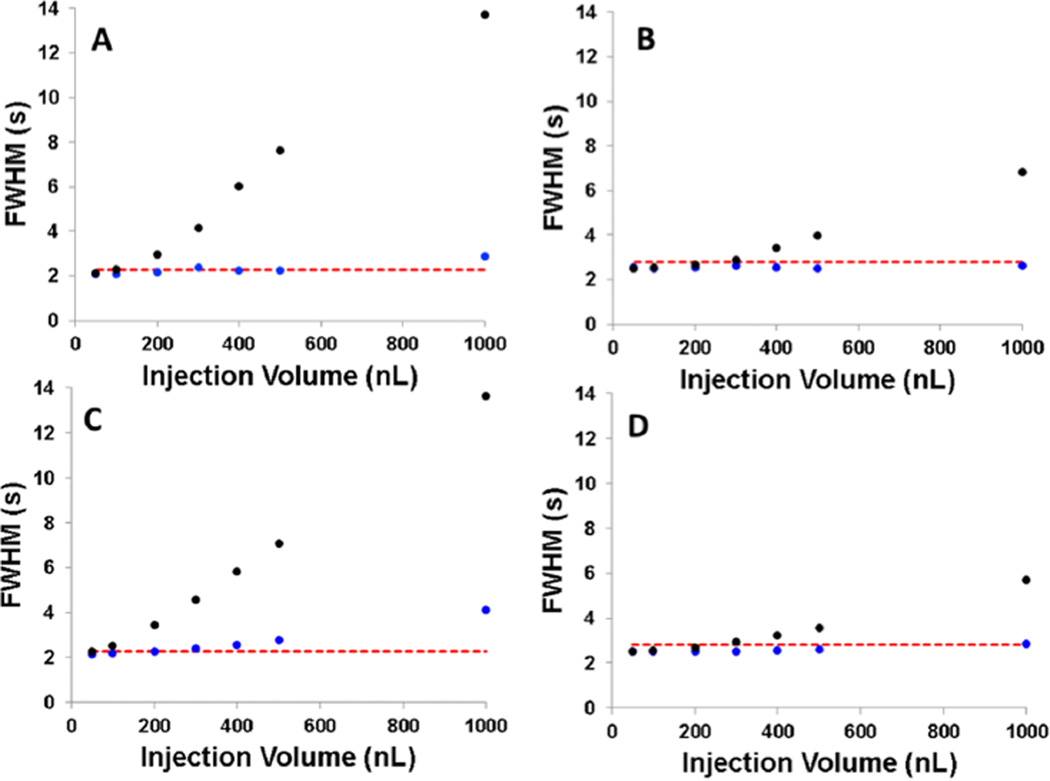
Figure 4.
Experimental and predicted peak widths under isothermal (black dots) and TASF (blue dots) conditions for injection volumes ranging from 50 to 1000 nL. Panels A and B are the experimental values for acetanilide and acetophenone, respectively, and Panels C and D are the calculated values for acetanilide and acetophenone, respectively, found using eqs 3 and 4 and based on experimental conditions. The red dashed line indicates 10% greater peak width than that measured at the 50 nL injection volume. Calculations are based on n = 3 replicates at each condition.

