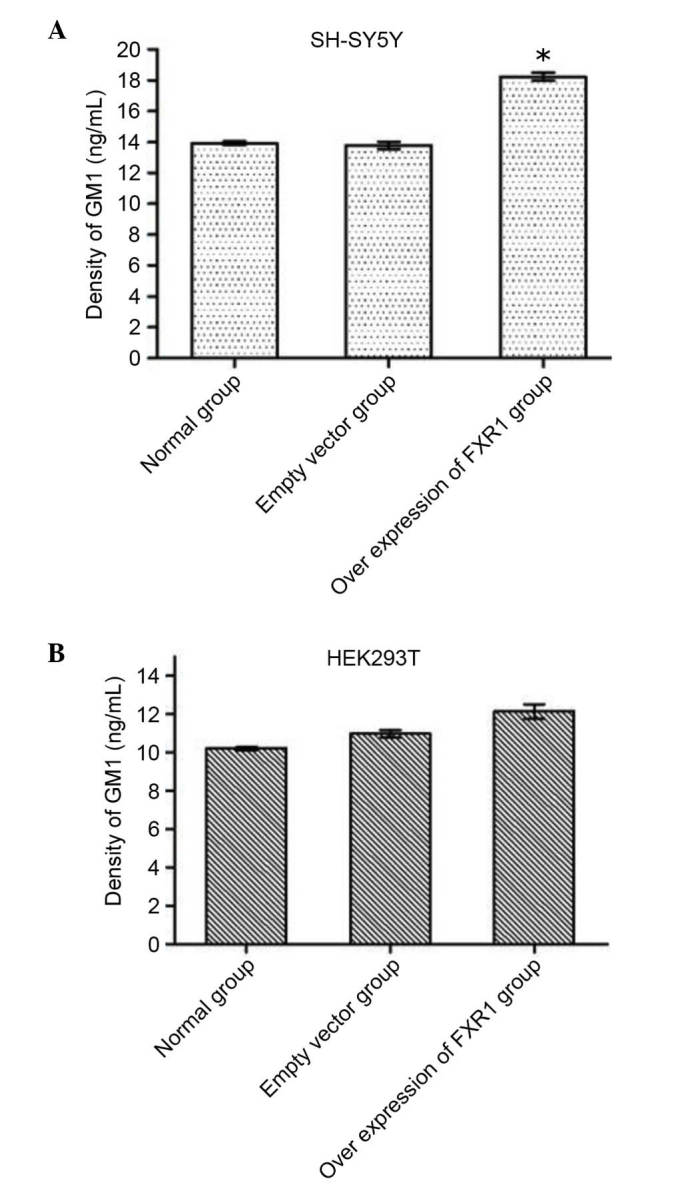
Figure 4.

Effect of different expression levels of the FXR1 gene on the concentration of GM1. (A) SH-SY5Y cells transfected with pcDNA3.1(-)-FXR1, (B) HEK293T cells transfected with pcDNA3.1(-)-FXR1, then lysed and enzyme-linked immunosorbent assay was performed. The GM1 concentration was detected by ND 2000c trace UV spectrophotometer. In SH-SY5Y cells, the GM1 concentration was not significantly increased when comparing the empty vector group with normal group, but there was a significant increase in the FXR1 gene overexpression group compared with the normal group (n=6). *P<0.05 vs. normal group. There were no significant differences in GM1 concentration in HEK293T cells among all three groups (P>0.05, n=6). GM1, monosialotetrahexosylganglioside; FXR1P, fragile X related 1.
