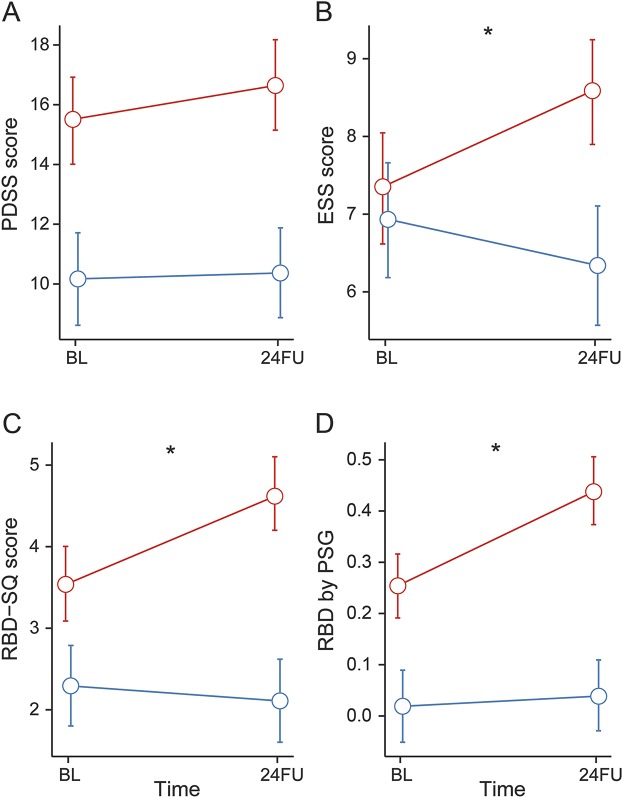
Figure 2. Longitudinal changes in sleep parameters.
Estimated means and 95% confidence intervals of the Parkinson's Disease Sleepiness Scale (PDSS-2) (A), Epworth Sleepiness Scale (ESS) (B), REM Sleep Behavior Disorder by Questionnaire (RBD-SQ) (C), and by video-supported polysomnography (PSG) (D), at baseline (BL) and 2-year follow-up (24FU). Blue line represents healthy controls (HC); red line represents participants with Parkinson disease (PD). *Significant change in PD vs HC (p < 0.05).

