Figure 4.

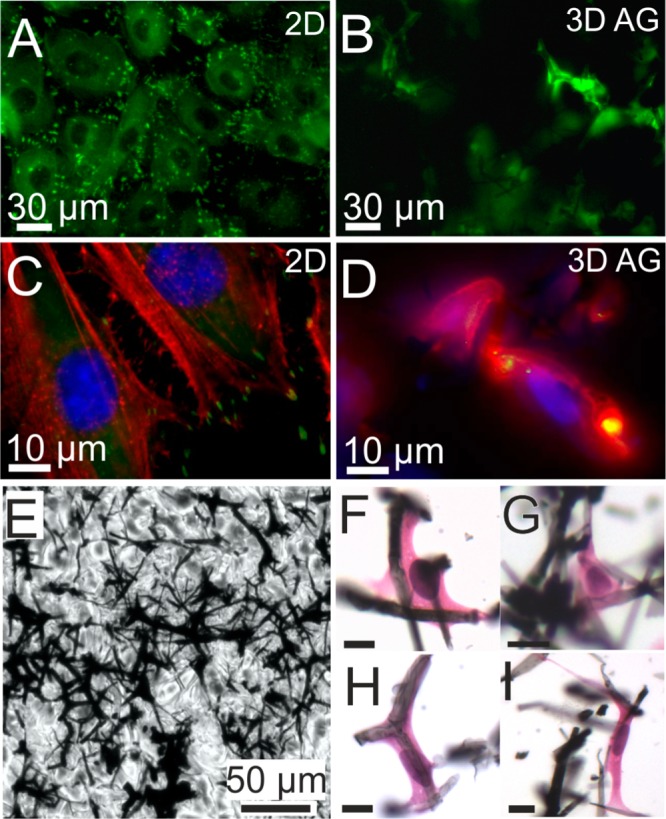
(A) YFP fluorescence (green) images of REF YFP-paxillin cells on a flat substrate, which have grown to a confluent layer. Bright fluorescent spots indicate focal adhesions of the cells. Intracellular homogeneous fluorescence originates in part from cytosolic paxillin. Dark circular regions indicate the area of cell nuclei. B) Optical section image approximately 100 μm from the surface. YFP-paxillin fluorescence appears to be associated with filament-like structures indicating cell growth along fibers of the scaffold. (C) Higher-magnification fluorescence image of REF YFP-paxillin cells on 2d substrate (focal adhesion sites; green) that were stained with DAPI (nuclei; blue) and RFP (stress fibers; red). (D) Optical section image approximately 50 μm from the surface, showing a mesh of actin (red) rather than stress fibers and smaller clusters of YFP-paxillin compared to the 2D substrate, which appear yellow due to overlap with red actin fluorescence. E) Bright field image of a 9 μm paraffin thin section from a position about 0.4 mm below the AG surface. Embedded in wax cells cannot be distinguished from the paraffin background. (F–I) Haematoxylin and eosin staining makes REF52 YFP Pax cells visible by coloring the nuclei blue (hematoxylin) and the cytosol pink (eosin). Due to vigorous dewaxing and staining treatment, the original AG section is highly fragmented. Nevertheless, higher-magnification reveals cells that are well-interfaced with AG filaments and illustrate morphologies typical for fibroblasts. Scale bars: 10 μm.
