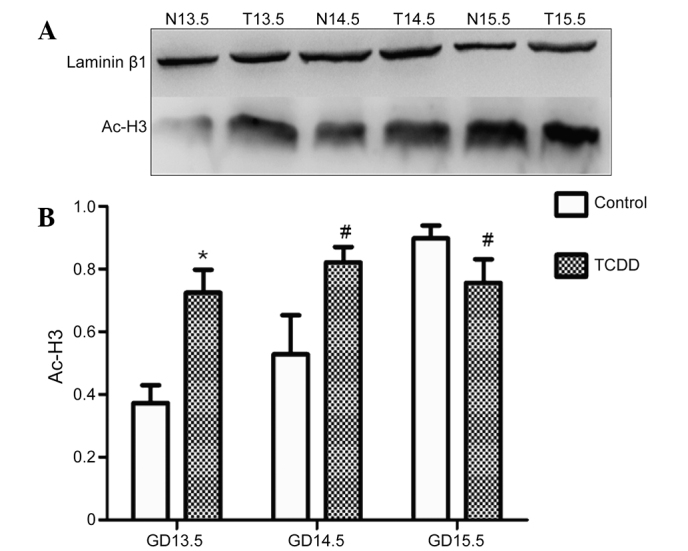
Figure 6.

Detection of Ac-H3 in the TCDD and control groups by western blotting. (A) Representative blot. (B) Statistical analysis of the acetylated histone H3 level. Data are presented as the mean ± standard deviation. *P<0.01 and #P<0.05 vs. the control group. N, control group, T, TCDD group. Ac-H3, acetylated histone 3; GD, gestation day; TCDD, 2,3,7,8-tetrachlorodibenzo-p-dioxin.
