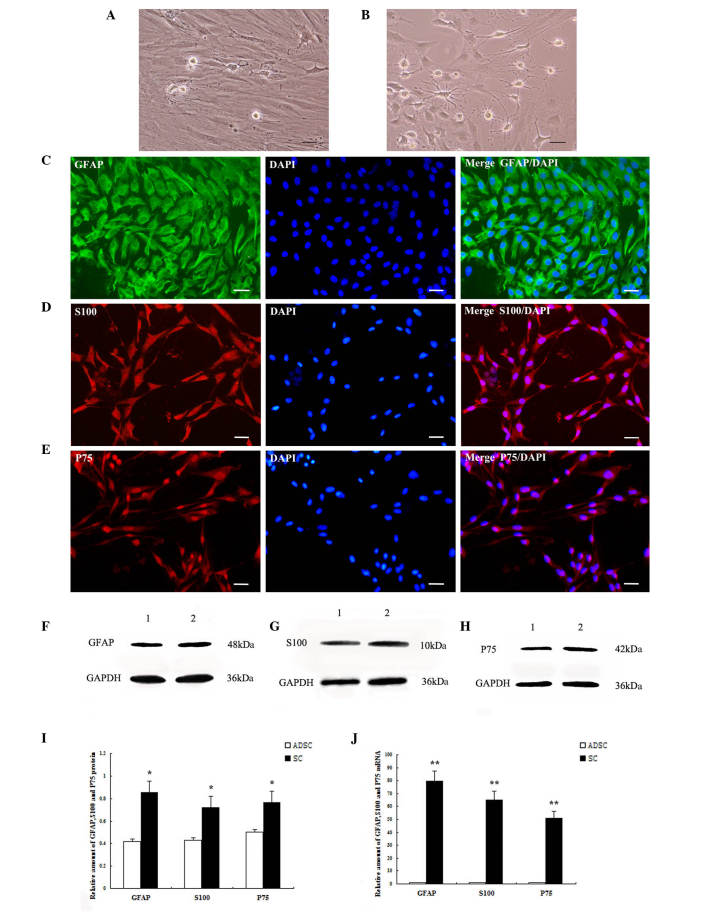
Figure 2.
ADSC differentiation into cells with an SC phenotype. (A) Cultured cells at the early stage of differentiation. (B) ADSCs differentiated into SC phenotype. Immunofluorescence staining of (C) GFAP, (D) S100 and (E) P75. Scale bar=100 µm. Cell nuclei were labeled with DAPI (blue). Detection of (F) GFAP, (G) S100 and (H) P75 proteins using western blot analysis. (I) Relative protein expression levels of GFAP, S100 and P75 (*P<0.05, vs. ADSCs). 1, ADSCs, 2, Schwann-like cells. (J) Detection of mRNA expression levels of GFAP, S100 and P75 using reverse transcription-quantitative polymerase chain reaction analysis (**P<0.01, vs. ADSCs). Values are presented as the mean ± standard deviation. SC, Schwann cell; ADSCs, adipose-derived stem cells; GFAP, glial fibrillary acidic protein.

