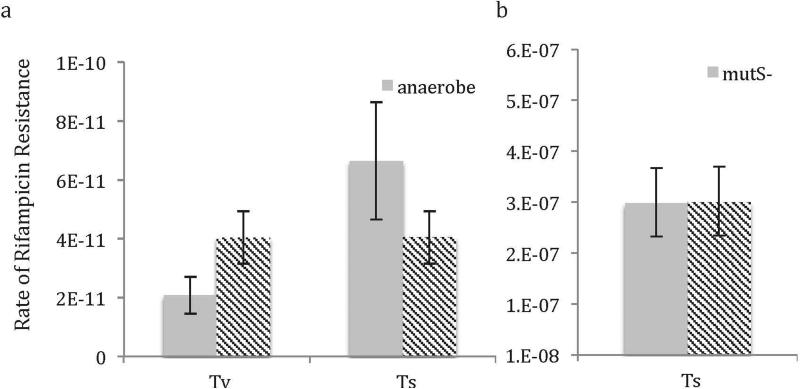
Extended Data Fig. 8.
Transversion (Tv) and transition (Ts) rates (per nucleotide-generation) as calculated in fluctuation assays in (a) anaerobic conditions and (b) in a mutS knockout. Note that because the Ts rate was so high in mutS- strains, Tv mutations could not be detected. Rates are mean. Error bars are 95% CI. N=25 (see Methods: Fluctuation Assays).

