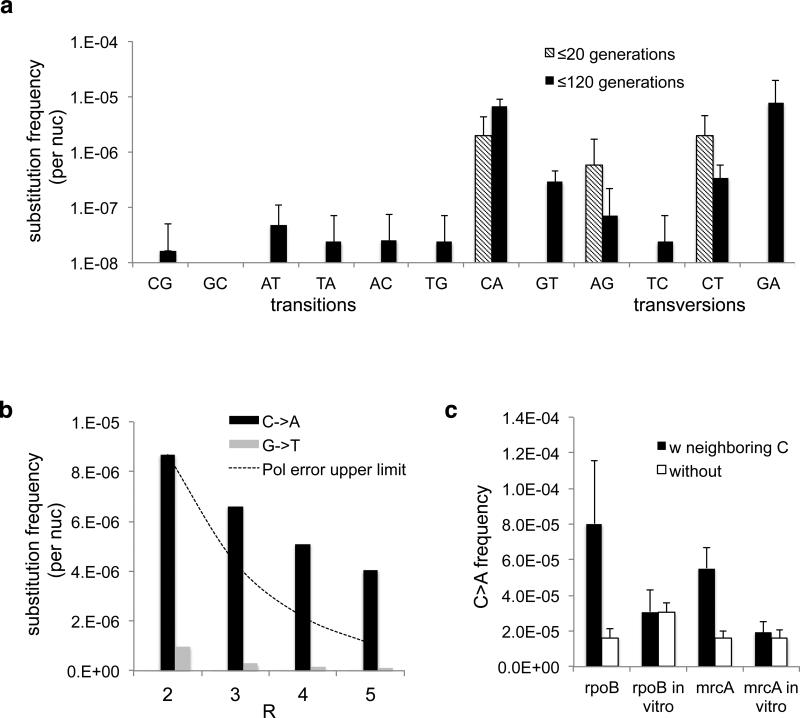
Fig. 3. Substitution spectra.
(a) Frequency of base substitutions recovered in our sequencing protocol at t=20 generations and t=120 generations in rpoB CDS. Values are not normalized by number of generations and thus are true frequencies, not mutation rates. Experiments are biological quadruplicates. Error bars are 95% CI upper bound. (b) The high frequency of C->A substitutions is consistent even as R increases. If these substitutions were polymerase errors due to damaged nucleotides, they should decline with increasing R faster than the line representing a model in which the polymerase makes C->A errors with 50% frequency for a subpopulation of DNA molecules (see Supplemental Information: Model of Damaged Base Pairs). (c) C->A substitutions in vivo cluster in nucleotides with at least 2 neighboring Cs within a 2bp radius, unlike polymerase errors (*=p<0.01 by t-test).

