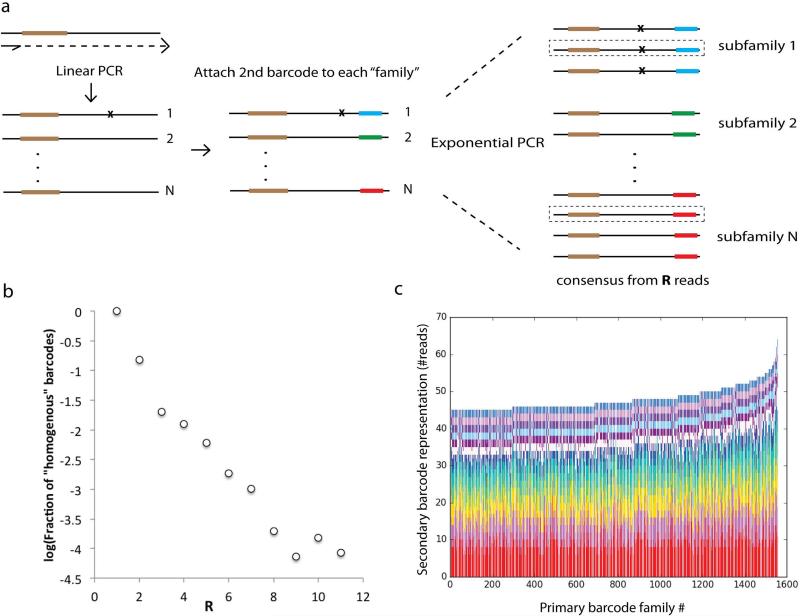
Extended Data Fig. 2.
(a) Barcodes are attached to original DNA molecules as per MDS protocol. After linear amplification, a second barcode is attached to the opposite end of each read (see Supplemental Information: Testing Sample Preparation and PCR Efficiency). Exponential PCR is then performed. In the analysis phase, reads can be grouped both by primary barcode (i.e. a classic MDS barcode family) and a second barcode corresponding to a “subfamily” of reads with the same parent from a particular linear amplification step before exponential amplification. (b) The probability that for a given family only reads of one subfamily are recovered (a “homogenous” barcode) decreases exponentially with R. For example, for R=3, the probability all 3 reads are of the same subfamily is 0.02. (c) We show the number of reads in each subfamily, sorted within each column by subfamily size, for the 1500 largest primary barcode families in the experiment. For families of such size, it is unlikely that a single subfamily will account for more than 25% of the total number of reads recovered from that family.

