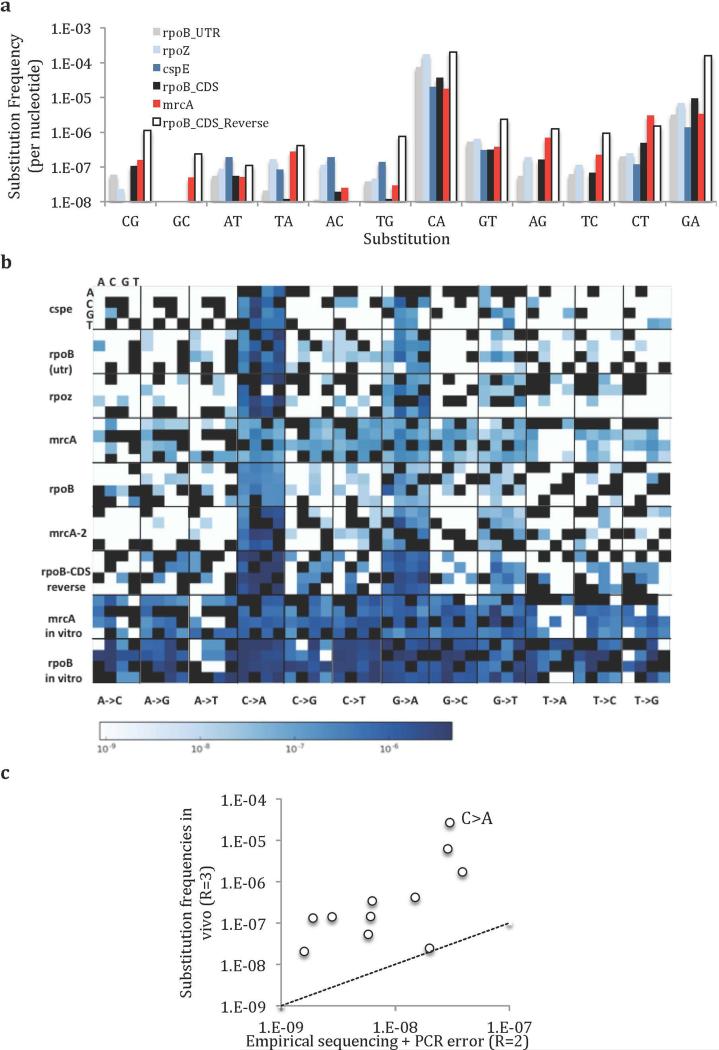
Extended Data Fig. 5. Mutational spectra and contexts.
a) Substitution frequencies of all ROIs after ~120 generations of growth. Note that values are not normalized for the number of generations and are thus true frequencies, rather than mutation rates. b) Mutation frequencies are shown in context of their 5’ (A, C, G, or T on the x axis) and 3’ (A, C, G, or T on the y axis) neighbors. c) The relative relationship between in vivo substitution frequencies and expected errors due to sequencing and PCR (from in vitro DNA assays) is poorly described by a linear approximation (R2 = 0.27). Furthermore, the recovered frequency from in vivo substitutions (R=3) is higher than the rate of error (equivalent frequencies would be represented by the dotted line), even with the relatively relaxed read-cutoff threshold of R=2 (The sequencing + PCR error with an R=3 cutoff is approximately an order of magnitude lower). Templates are rpoB CDS and mrcA ROIs.

