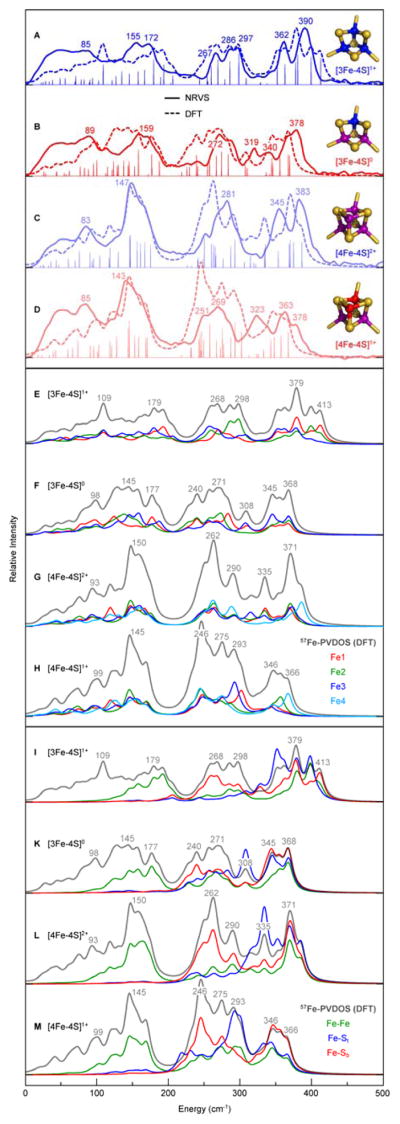
Fig. 2.

NRVS- and DFT-derived 57Fe-PVDOS and KED spectra for the 57Fe-enriched [3Fe-4S] and [4Fe-4S] variants of Pf Fd D14C at the reduced and oxidized levels. Top panel (A–D): overlay of the observed NRVS (solid line) and calculated DFT (broken line) spectra. The non-broadened intensities (and normal mode positions) from DFT are given in stick-style. On right, electronic structures of the Fe-S clusters are schematically shown, where Fe3+/2.5+/2+ are in blue/purple/red, respectively, and sulfide ligands are in yellow (see extended version of the top panel in Fig. S3†). Middle panel (EH): breakdown of the DFT spectra into contributions from individual Fe sites; Fe1/2/3/4 in red/green/blue/cyan, respectively. Bottom panel (I–M): DFT KED profiles for the Fe-bonding interactions; Fe–Fe/Fe–St/Fe–Sb lines are in green/blue/red, where St/b are terminal/bridging (cysteinate/inorganic) sulfides, respectively. Top to bottom in each panel: [3Fe-4S]1+ (A,E,I); [3Fe-4S]0 (B,F,K); [4Fe-4S]2+ (C,G,L); [4Fe-4S]1+ (D,H,M). The NRVS/DFT band positions are labeled in the top (A–D)/middle and bottom (E–M) panels, respectively. The data on the [4Fe-4S] variant have been in part published previously.19
