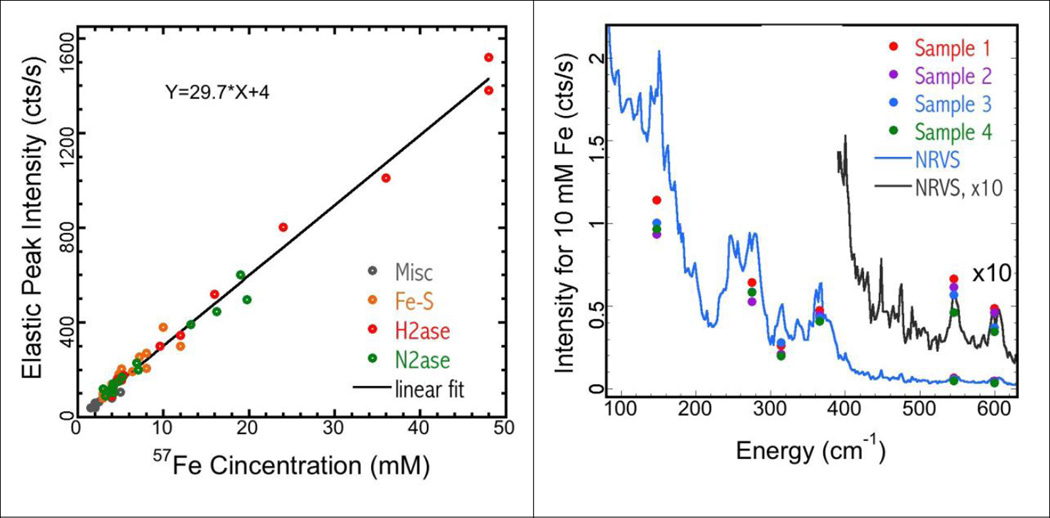
Figure 9.
Left: the relationship between the elastic peak intensity (cts/s) and the 57Fe concentration measured at SPring-8 BL09XU. Right: the NiFe H2ase NRVS spectrum, being scaled to an assumed 10 mM Fe concentration, and showing the Fe-S (blue) and Fe-CO (x10, black) vibrational features. The symbols are the intensity distribution for the corresponding peaks in four measurements (on four different NiR samples).

