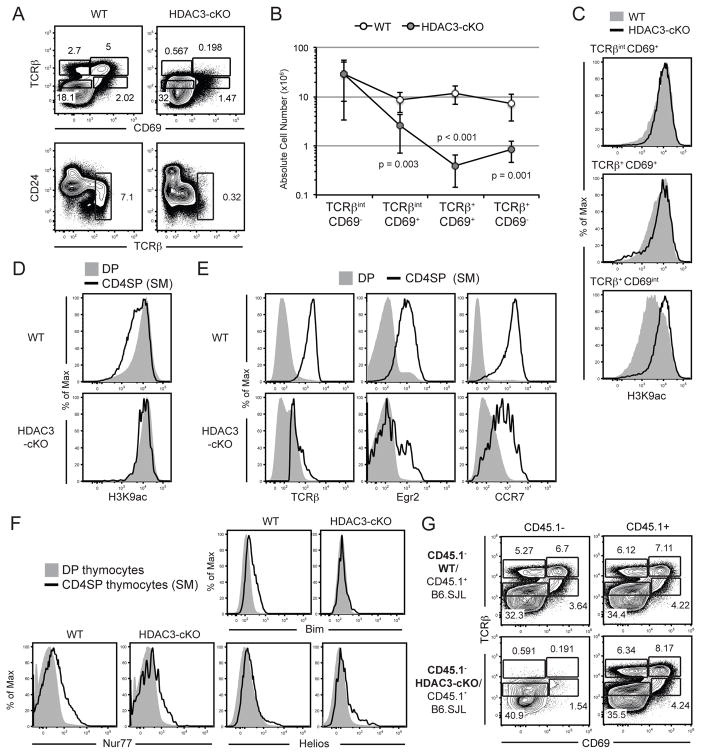
Figure 2. HDAC3-cKO mice exhibit a block in positive selection.
(A) TCRβ-versus-CD69 profile and CD24-versus-TCRβ profile of WT and HDAC3-cKO thymocytes to examine positive selection. The gating strategy delineates Immature (TCRβintCD69−), Selecting (TCRβintCD69+), Post-positive selection (TCRβ+CD69+) and Mature (TCRβ+CD69−) thymocytes. (B) Quantification of absolute cell numbers of each gate in (A), with error bars reflecting SEM. Data shown are from seven mice per group from six independent experiments. Please note that the data is presented on a logarithmic scale. (C) Examination of H3K9Ac in selecting (TCRβintCD69+), Post-positive selection (TCRβ+CD69+), and Mature (TCRβ+CD69−) thymocytes from WT and CD2-icre HDAC3-cKO mice. Data is representative of five mice per group from four independent experiments. (D) Expression of H3K9ac on DP and semi-mature CD4SP thymocytes (TCRβ+CD24+) from WT and HDAC3-cKO mice. Data is representative of five mice per group from four independent experiments. (E) Expression of TCRβ, Egr2, and CCR7 on DP and semi-mature CD4SP thymocytes (TCRβ+CD24+) from WT and HDAC3-cKO mice. Data is representative of at least four WT and at least four HDAC3-cKO mice from at least two independent experiments. (F) Intracellular expression of Nur77, Bim, and Helios on DP and semi-mature CD4SP thymocytes (TCRβ+CD24+) from WT and HDAC3-cKO mice. Data is representative of at least three mice per group from two independent experiments. (G) TCRβ-versus-CD69 expression of CD45.1− or CD45.1+ cells from 50/50 mixed BMCs from WT (CD45.1−)/B6.SJL (CD45.1+) and HDAC3-cKO (CD45.1−)/B6.SJL (CD45.1+) mice. Mice were analyzed 9–11 weeks post transfer. Plot is representative of five mice per group.

