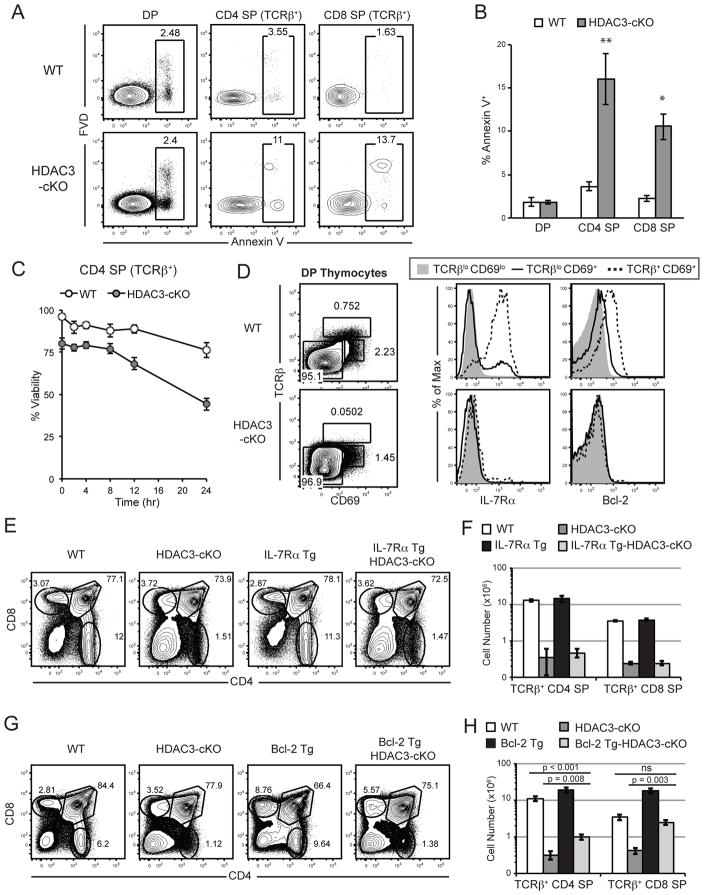
Figure 4. HDAC3-deficient thymocytes exhibit a survival defect due to a failure to express Bcl-2.
(A) Shown is a representative analysis of apoptotic DP, TCRβ+ CD4SP and TCRβ+ CD8SP thymocytes in WT and HDAC3-cKO mice using Annexin V and fixable viability dye (FVD). (B) Quantification of frequency of apoptotic Annexin V+ DP, TCRβ+ CD4SP and TCRβ+ CD8SP thymocytes from WT and HDAC3-cKO mice as depicted in (A). Data shown are the mean ± SEM of five to seven mice per experimental group from three independent experiments. *p < 0.05 and **p < 0.01. (C) Viability of thymocytes in culture over the time period shown. Plot identifies the percentage of live (Annexin V− FVD−) TCRβ+ CD4SP thymocytes. Data shown is the mean viability ± SEM from four to five mice per group from two independent experiments. The two curves are statistically different with p<0.011 using two-way ANOVA. (D) IL-7Rα surface expression and Bcl-2 intracellular expression of pre-positive selection (TCRβloCD69lo), selecting (TCRβlo CD69+), and post-positive selection (TCRβ+CD69+) DP thymocytes. Data is representative of at least ten mice per experimental group. (E) Representative analysis of thymic development in WT, HDAC3-cKO, IL-7Rα Tg, and IL-7Rα Tg-HDAC3-cKO mice is shown. (F) Quantification of the absolute cell numbers of TCRβ+ CD4SP and TCRβ+ CD8SP thymocytes from WT, HDAC3-cKO, IL-7Rα Tg, and IL-7Rα Tg-HDAC3-cKO mice. (E–F) Data shown are the mean ± SEM from three mice per group from at least three independent experiments. Please note that the data is presented on a logarithmic scale. (G) Representative analysis of thymic development in WT, HDAC3-cKO, Bcl-2 Tg, and Bcl-2 Tg-HDAC3-cKO thymocytes is shown. (H) Quantification of the absolute cell numbers of TCRβ+ CD4SP and TCRβ+ CD8SP thymocytes from WT, HDAC3-cKO, Bcl-2 Tg, and Bcl-2 Tg-HDAC3-cKO mice. (G–H) Data shown are the mean ± SEM from five to seven mice per group from at least five independent experiments. Please note that the data is presented on a logarithmic scale.

