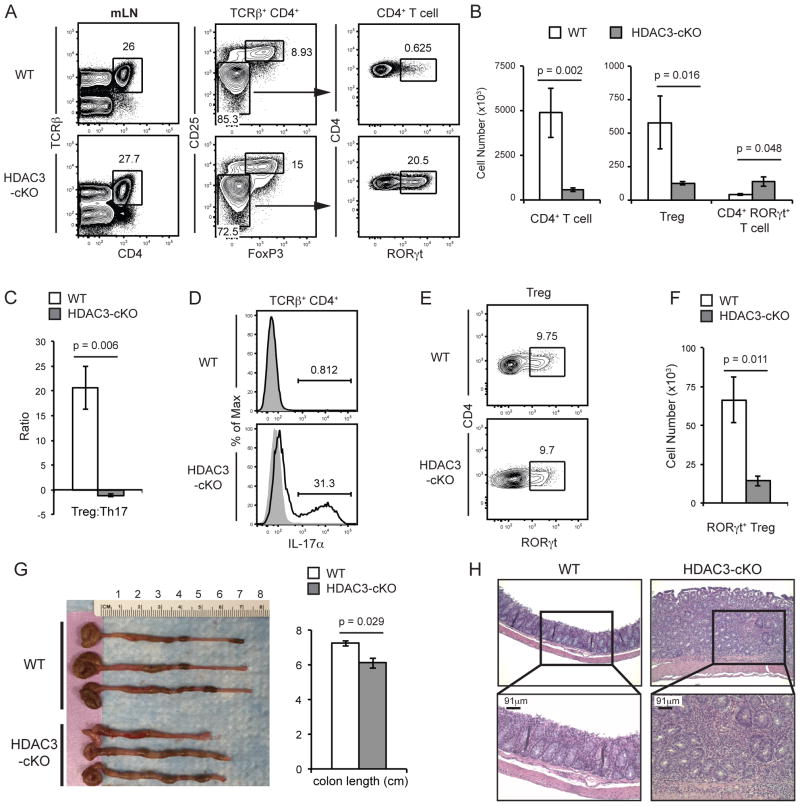
Figure 8. HDAC3-cKO mice develop IBD.
(A) Frequency and (B) absolute cell numbers of CD4+ T cells (TCRβ+, CD4+), Tregs (TCRβ+, CD4+, CD25+, FoxP3+), and RORγt+ Th17 cells in mesenteric lymph nodes (mLN) from WT and HDAC3-cKO mice. Data shown are the mean ± SEM of six to seven mice per group from three independent experiments. (C) Ratio of Treg to RORγt+ Th17 cells in mLNs from WT and HDAC3-cKO mice. Data shown are the mean ± SEM of six to seven mice per group from three independent experiments. (D) Frequency of IL-17α+ mesenteric CD4+ T cells stimulated with PMA/Ionomycin from WT and HDAC3-cKO mice. Data is representative of four mice per group from two independent experiments. (E) Frequency and (F) absolute cell numbers of RORγt+ Tregs cells in mLN from WT and HDAC3-cKO mice. Data shown are the mean ± SEM of seven to eight mice per group from four independent experiments. (G) Image and quantification of colon length from WT and HDAC3-cKO mice. (H) H&E stained sections of colon from WT and HDAC3-cKO mice. Scale bar reflects 91μm acquired at 20x magnification. Data is representative of two WT and three HDAC3-cKO mice.

