
Figure 2. Whole-Brain Growth Trajectories, Daily Growth Rates, and Volume-for-Age Percentile Plots.
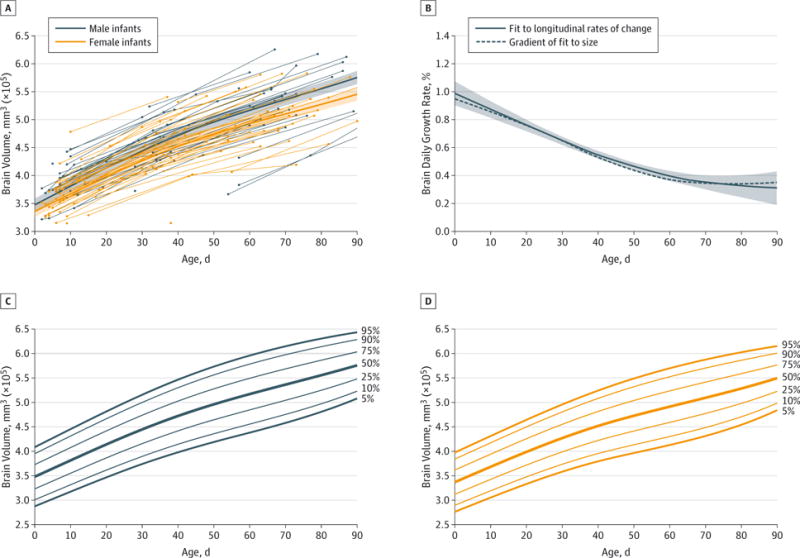
A, Spaghetti plot showing whole-brain volume for 39 male and 48 female infants (94 and 117 time points, respectively) during the first 3 months of postnatal life, along with generalized additive mixed model (GAMM) fits to the data (dark lines, from the Equation), and 95% CIs (shaded regions); see also eFigure 2 in the Supplement. B, Daily growth rate for the whole brain during the first 3 months of postnatal life (for male and female infants combined). The dashed line is the gradient of a GAMM fit for whole-brain volume trajectory; the solid line is a GAMM fit to centered linear estimates of the growth rates (between each subject’s neighboring data points) from the longitudinal data only. Whole-brain volume-by age percentile plots for boys (C) and girls (D) (see also eFigure 3B and 3D in the Supplement); these plots can be used when controlling for an infant’s head circumference and gestational age at birth.