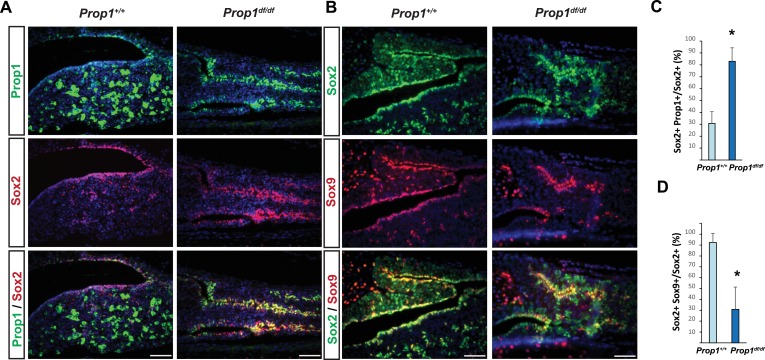
Figure 3. Prop1 regulates Sox2+ stem cell population.
Double immunofluorescence labeling of PROP1 and SOX2 (A) and SOX2 and SOX9 (B) in wild-type control and Prop1 mutants at P3. (C) Quantification SOX2+, PROP1+ cells among SOX2+ cells in the marginal zone in control and mutants. (D) Quantification SOX2+, SOX9+ cells among SOX2+ cells in the marginal zone in control and mutants. Data are represented as mean ± SEM (n = 3 mice, *p<0.05). Scale bars, 50 µm.


