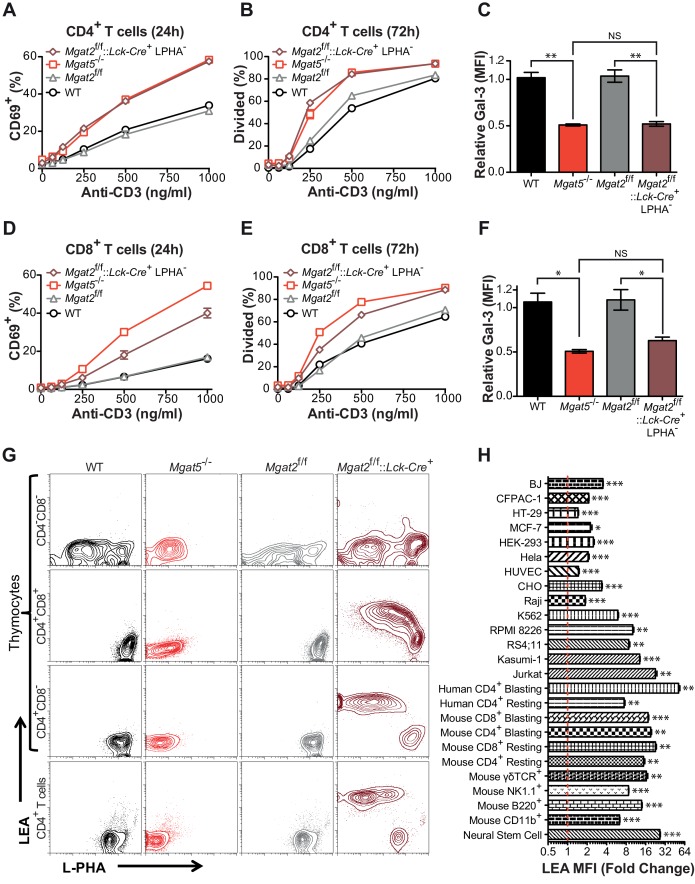
Figure 1. Compensation limits hyperactivity of Mgat2 deficient T cells.
(A, B, D and E) T cells were activated with plate bound anti-CD3 for 24 (A and D) or 72 (B and E) hours. CD4+ (A and B) or CD8+ (D and E) cells were analyzed for CD69 expression (A and D) or 5, 6-carboxyfluorescein diacetate succinimidyl ester (CFSE) dilution (B and E) by flow cytometry, gating on L-PHA- cells where indicated. (C and F) T cells were analyzed for galectin-3 binding by flow cytometry, gating on CD4+ (C) or CD8+ (F) cells and L-PHA- cells where indicated. Normalized geometric mean fluorescence intensity (MFI) is shown. Each mutant was normalized to its control. (G) Thymocytes and splenic T cells were analyzed for L-PHA and LEA binding by flow cytometry. (H) Cells were treated in culture with or without 500 nM SW for 72 hr followed by analysis of LEA binding by flow cytometry. Fold increase in LEA MFI of the SW treated sample compared to the untreated sample is presented. The red line marks one fold or no change. NS, not significant; *p<0.05; **p<0.01; ***p<0.001 (unpaired two-tailed t-test with Welch’s (C, F and H) and Bonferroni correction (C and F)). Data show one experiment representative of at least three independent experiments. Error bars indicate mean ± s.e.m.


