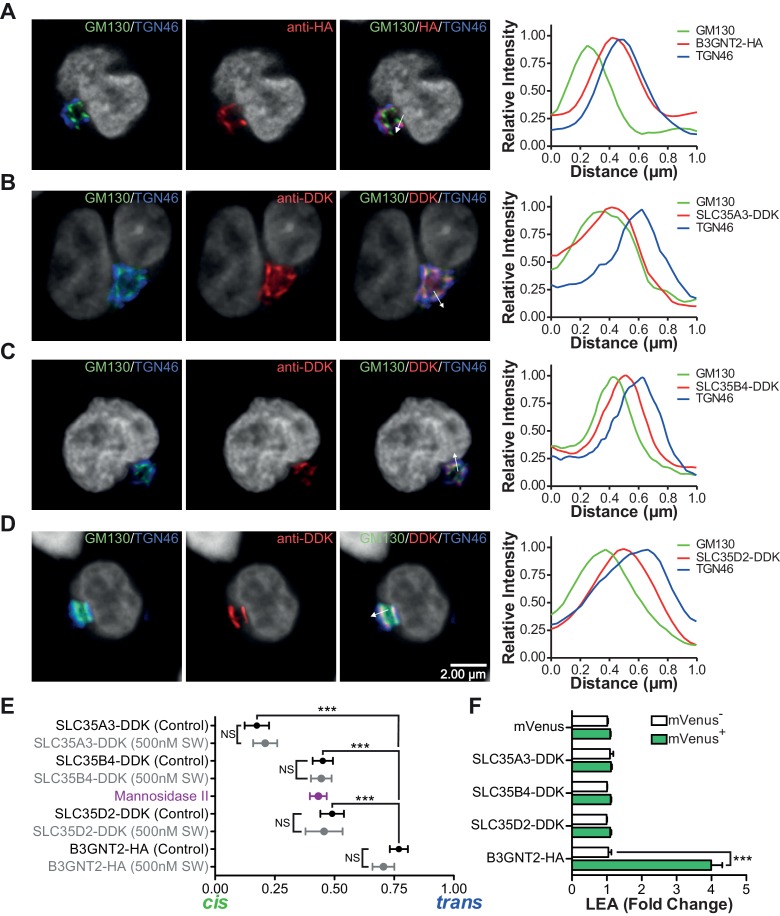
Figure 5. The UDP-GlcNAc transporters are localized to an earlier Golgi compartment than B3GNT2.
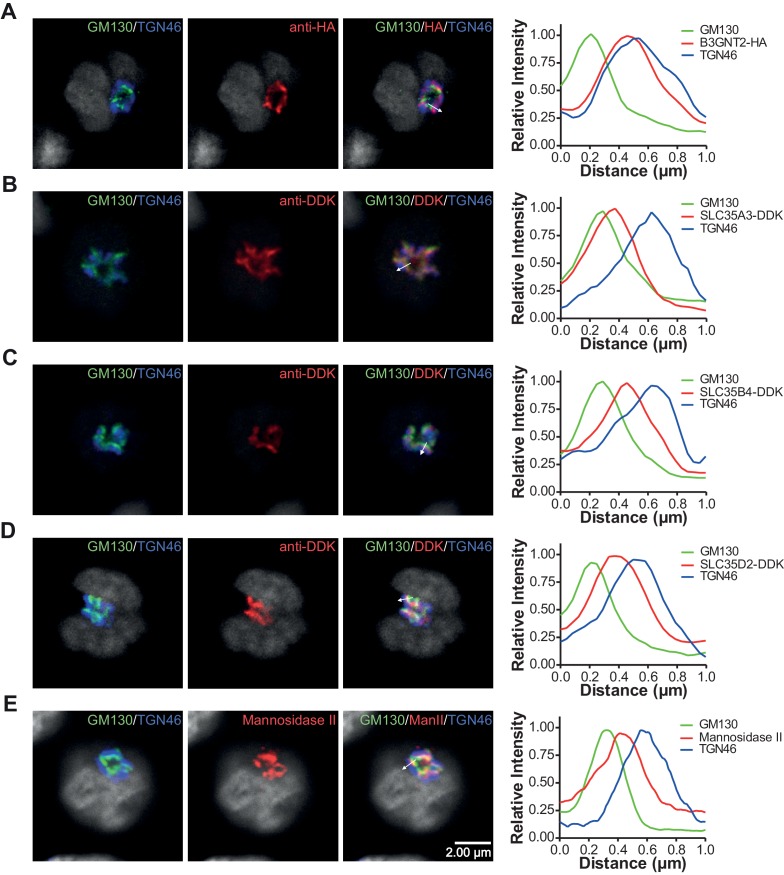
(A–D) Jurkat T cells were transfected with plasmids containing B3GNT2-HA (A), SLC35A3-DDK (B), SLC35B4-DDK (C), or SLC35D2-DDK (D), cultured for 24 hr and then stained for GM130 (green), TGN46 (blue) and either anti-HA (A) or anti-DDK (B–D) in red. Shown are representative confocal slices from transfected cells. The white arrows demonstrate areas deemed suitable for line scan analysis and the histograms (far right) demonstrate signal intensities along the line scans. DAPI staining is shown in grey scale. (E) Average localizations of the indicated Golgi proteins in Jurkat T cells treated with and without swainsonine (see Figure 5—figure supplement 1) relative to GM130 (cis) and TGN46 (trans) markers. Error bars show standard deviation. (F) Jurkat cells were transfected with mVenus alone or in combination with the four constructs of interest. After 48 hr, cells were analyzed for LEA binding by flow cytometry gating on mVenus- and mVenus+ cells as indicated. NS, not significant; *p<0.05; **p<0.01; ***p<0.001 (unpaired two-tailed t-test with Welch’s (E and F) and Bonferroni correction (E)). Data show images and histograms from representative cells (A–D), or pooled analysis from 30–40 cells per condition (E). Error bars indicate mean ± S.D. (E) or mean ± s.e.m (F).


