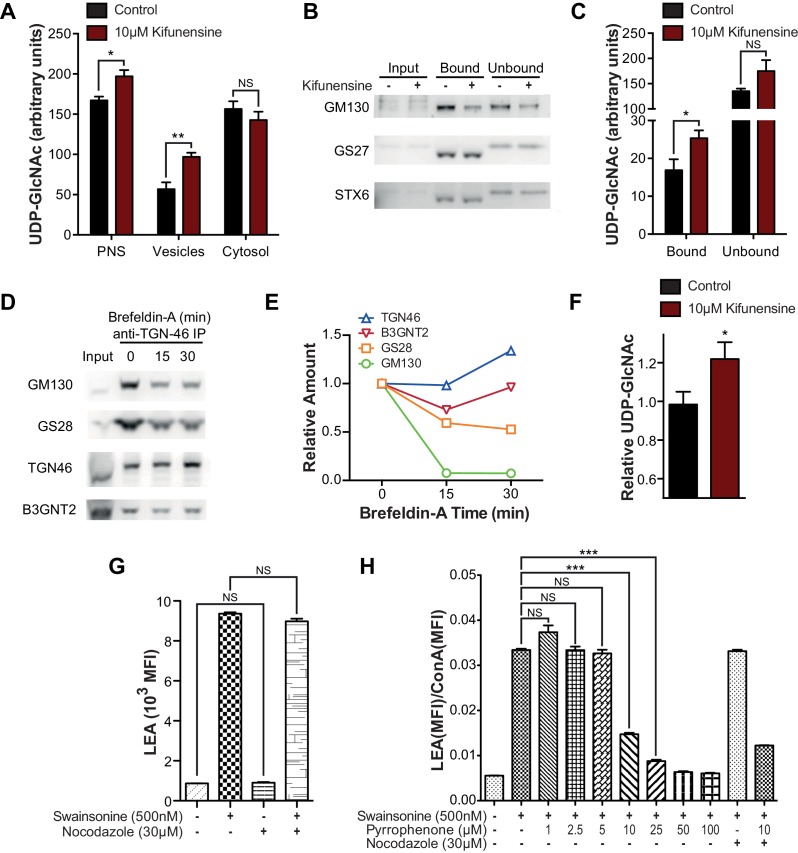
Figure 6. Intra-Golgi UDP-GlcNAc shifts to later Golgi compartments when use in the medial Golgi is inhibited.
(A) LC-MS/MS quantitation of UDP-GlcNAc in post-nuclear supernatants (PNS), vesicular, and cytosolic fractions of kifunensine treated and untreated Jurkat T cells. (B) PNS (input) from kifunensine treated and untreated Jurkat T cells was used for Golgi enrichment via anti-TGN46 immuno-isolation followed by blotting for the Golgi compartment markers GM130 (cis), GS27 (medial/trans), and Syntaxin6 (trans). (C) LC-MS/MS quantitation of UDP-GlcNAc in anti-TGN46 bound and unbound fractions from kifunensine treated and untreated Jurkat T cell PNS. (D) PNS of Jurkat T cells treated for 0, 15, and 30 min with the Golgi disruptor Brefeldin A were used for anti-TGN46 immuno-isolation followed by blotting for B3GNT2 and the GM130 (cis), GS28 (cis/medial), and TGN46 (trans) Golgi markers. (E) Quantitation of D, (F) LC-MS/MS quantitation of UDP-GlcNAc in anti-TGN46 immuno-isolates from Jurkat cells treated with Brefeldin A for 15 min. (G) LEA flow cytometric analysis of Jurkat T cells pre-treated with nocodazole where indicated for 45 min, followed by swainsonine where indicated for 5 hr. (H) Jurkat T cells that were treated with nocodazole +/- pyrrophenone as indicated for 45 min were treated with or without swainsonine for 5 hr and then analyzed for LEA and ConA binding by flow cytometry. Shown is the ratio of LEA MFI to ConA MFI for each condition. NS, not significant; *p<0.05; **p<0.01; ***p<0.001; (unpaired one-tailed (A, C, F and G) or two-tailed (H) t-test with Welch’s correction and Bonferroni correction (H)). Data show one experiment representative of at least three independent experiments except F which shows combined data from two independent experiments. Error bars indicate mean ± s.e.m.


