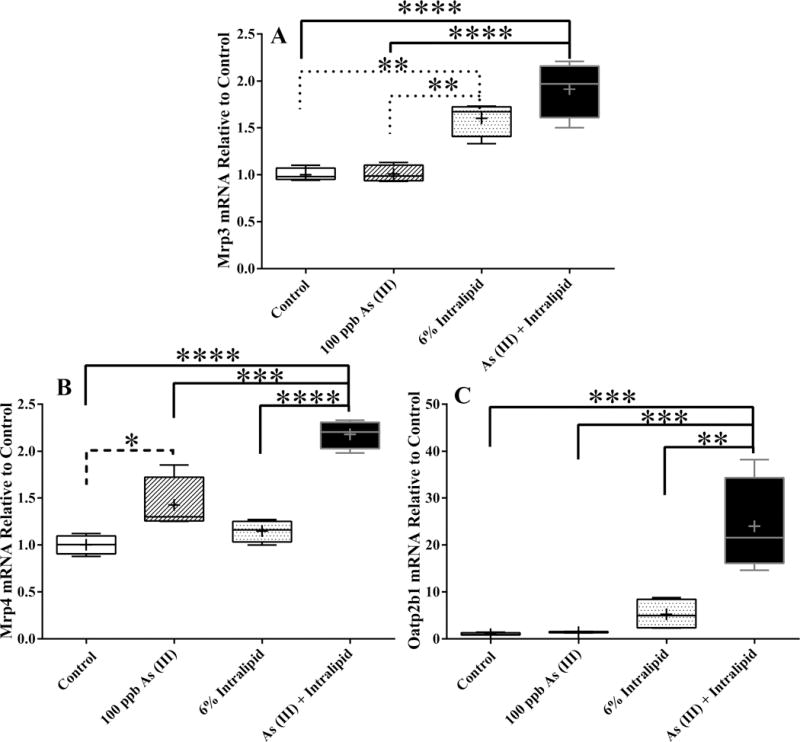
Figure 4. Effects of Intralipid and As (III) on Transporter Gene Expression in Embryonic Liver Culture.

mRNA levels of select Mrp and Oatp transporter genes found to be statistically different than control with described treatments are shown as fold change compared to control. The box extends from 25th to 75th percentile and whiskers show the entire distribution: the horizontal line is the median and the + is the mean. Analytical duplicates were used and a one-way ANOVA followed by a Tukey’s multiple comparison test utilizing Prism6 (GraphPad) for comparisons between groups: the reported p-value is the multiplicity adjusted p-value corrected for multiple comparisons. (**** = p ≤ 0.0001; *** = p ≤ 0.001; ** = p ≤ 0.01 ; * = p ≤ 0.05 compared to controls). n=4.
