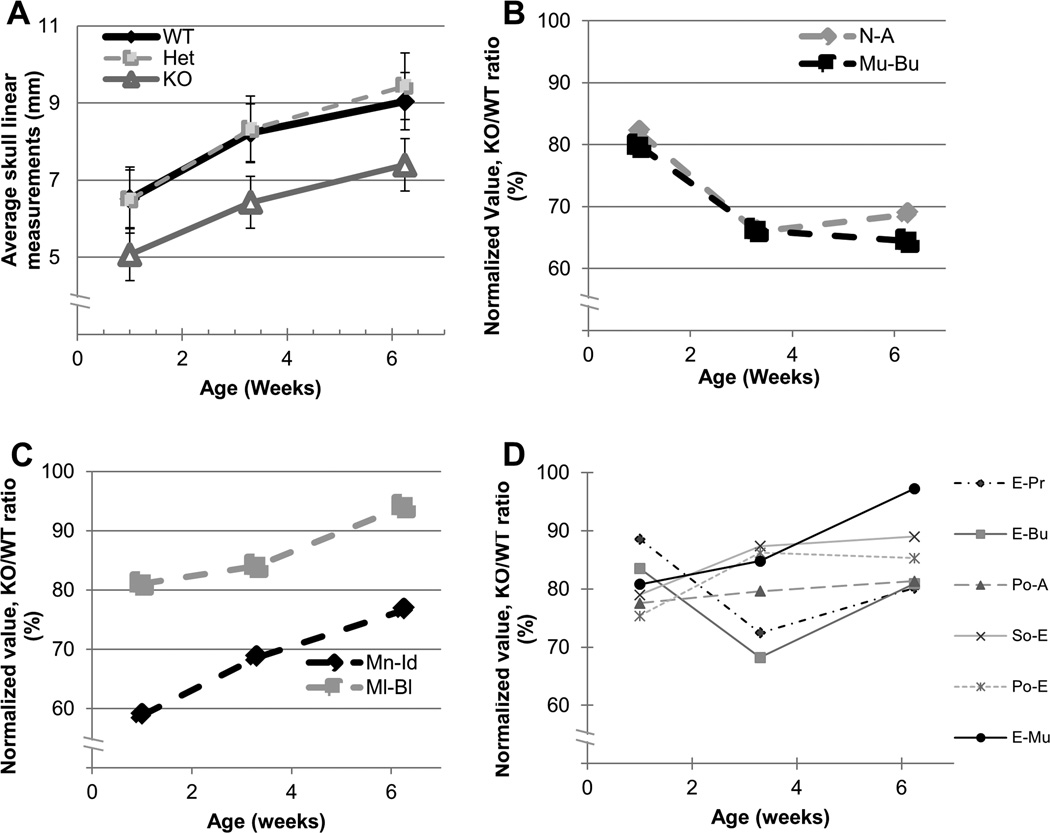
Figure 5. Growth impairment of specific craniofacial bones in Evc2 KO mice.
(A) The profile of averaged linear bone measurements. The average of all the linear bone measurements in each genotype was calculated at each time point by the total of linear measurements of all the craniofacial bones divided by the total number of bones and displayed as (average skull linear measurements). The profile of averaged measurement values during postnatal development in KO was similar to that in WT and Het, while the value in KO was lowered by 28.5% at 1 week, 28.0% at 3 weeks, and 22.3% at 6 weeks compared to WT, and lowered by 27.8% at 1 week, 29.4% at 3 weeks and by 27.6% at 6 weeks comparing to Het. The values in WT and Het were essentially same. (B, C, D) Values of linear measurements of each individual bone in KO at each time point were normalized to those in WT and are shown as (KO/WT ratio, %). (B) The KO/WT ratios of nasal (N-A) and palatal (Mu-Bu) bones were markedly decreased at 3 and 6 weeks. (C) Although mandibular bone growth was lowered at 1 week, the KO/WT ratio of this bone was significantly improved at 3 weeks and further increased at 6 weeks. (D) The change of KO/WT ratios of other craniofacial bones (E-Pr, E-Bu, Po-A, So-E, Po-E, E-Mu, Ml-Bl) was within ~20% of the range. N-A; nasal bone length, Mu-Bu; palatal length, Mn-Id; mandibular corpus length, Ml-Bl; mandibular lingual alveolar bone.

