
Figure 1.
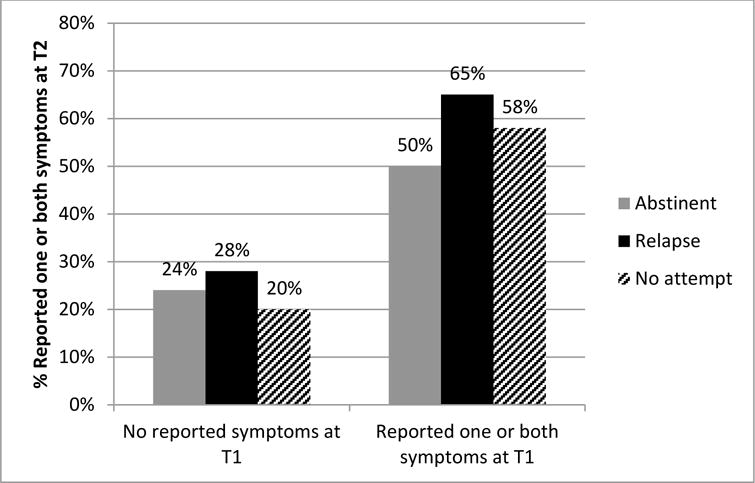
This figure shows data from all observations included in the study. The percentage that reported one or two symptoms at T2 (y-axis) is stratified by reported symptoms at T1 (x-axis) and smoking status at T2 (columns).
Total number of observations: No symptoms at T1 = 7,635, 63% no attempt; 24.5% relapse; 12.1% abstinent; One or both symptoms at T1 = 5,468, 58.1% no attempt; 31.6% relapse; 10.2% abstinent.