FIG. 2.
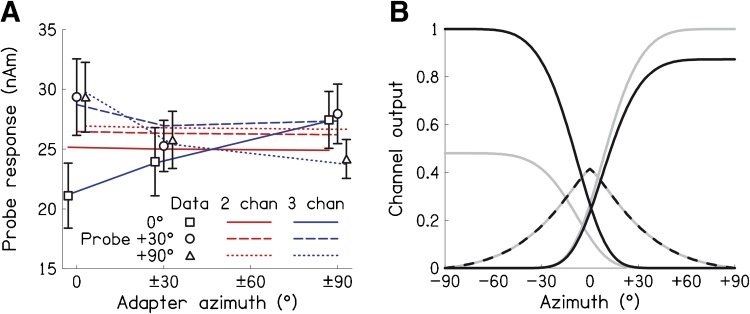
A Symbols show probe response size as a function of adapter locations for each probe location, averaged across cortices and participants. Errors bars are 95 % within-subjects confidence intervals (Morey 2008). Red lines show fits of a two-channel model, whilst blue lines show fits of a three-channel model. Symbols and lines are slightly offset horizontally for clarity. B Fitted channel tuning curves under the three-channel model. Light grey, and black, shows fits for left, and right, auditory cortex, respectively. Only the peak output of the ipsilateral channel was allowed to vary between cortices.

