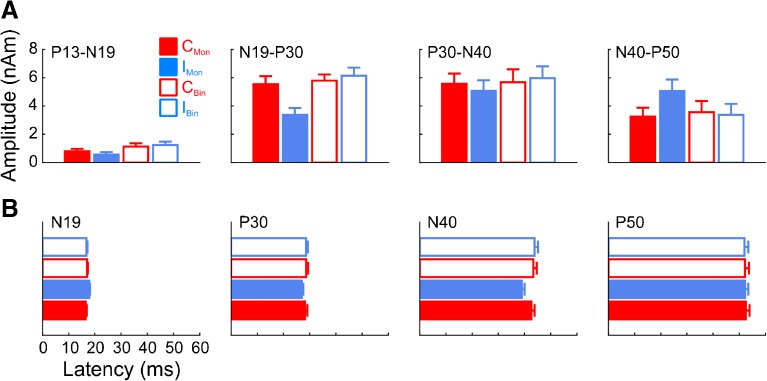
Fig. 2.
Cortical amplitude (A) and latency (B) quantifications for each of the four component pairs (for amplitude) or components (for latency). Error bars denote standard error of the mean across listeners. Legend as in Fig. 1. For display purposes, values were collapsed across hemispheres but analyzed separately statistically.

