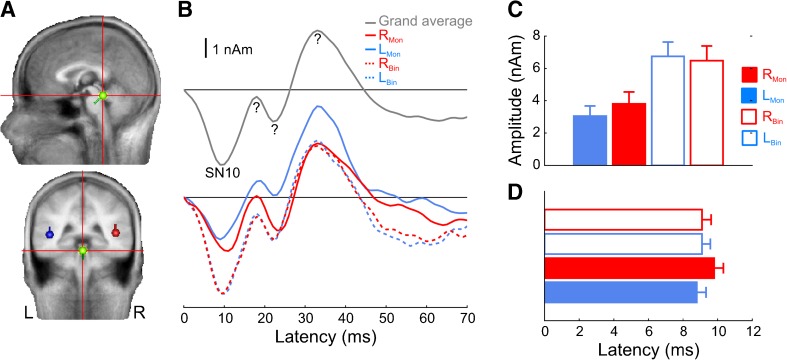
Fig. 3.
Midbrain source analysis and amplitude/latency quantifications. A Average source orientation. B Grand-averaged source waveforms collapsed across all conditions (top panel) and for each of the five stimulus conditions separately (bottom panel). The SN10 is clearly visible as a negative-going deflection at ∼10 ms. R Mon right-ear monaural stimulus, L Mon left-ear monaural stimulus, R Bin right-leaded binaural stimulus, L Bin left-leading binaural stimulus. Question marks denote components of questionable source origin. C, D SN10 amplitude and latency quantifications for all conditions. Legend same as in B. Error bars denote standard error of the mean across listeners.

