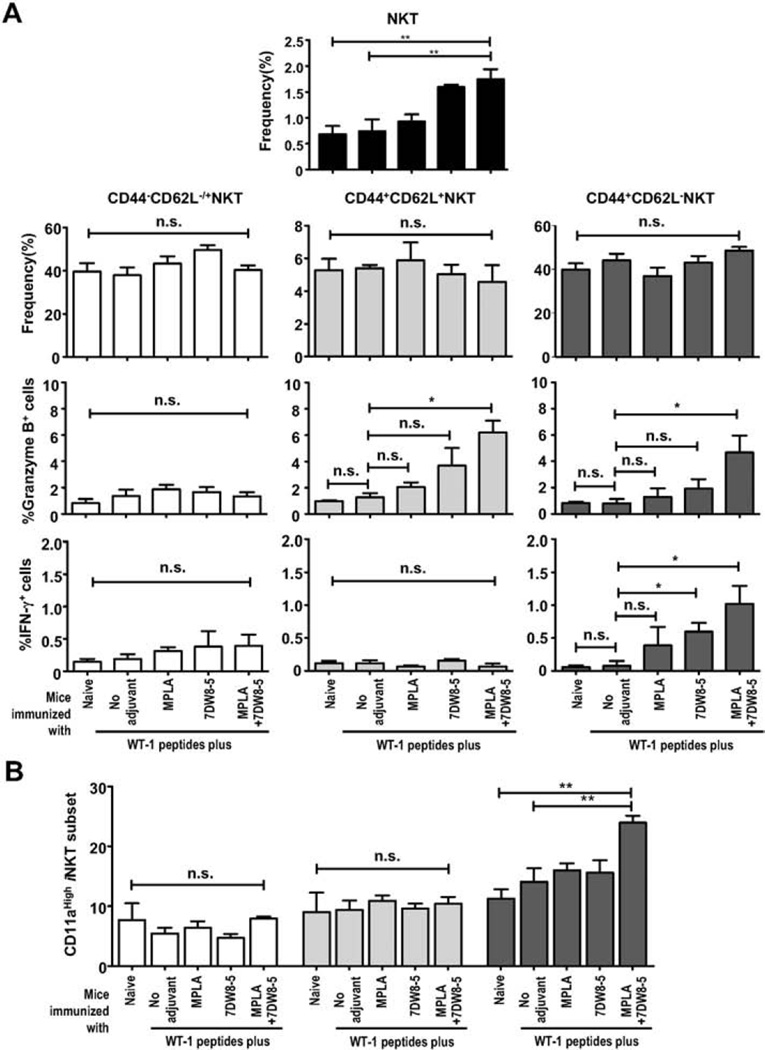
Fig. 3.
Analysis of NKT-cell memory subsets. Splenocytes were obtained from a group (n = 5) of naïve HLA-A2 transgenic mice (B6 background), as well as groups (n = 5) of mice received five doses of i.m. immunization with two WT-1 peptides, or with WT-1 peptides mixed with 7DW8-5 and/or MPLA. Then the percentages of CD44−CD62L+/− (naïve); CD44+CD62L+ (central); CD44+CD62L− (effector) and total NKT-cell subsets were analyzed by FACS. Results are expressed as the percentages of total splenocytes. In (A), the percentages of the NKT-cell subsets, Granzyme B+-cells and IFN-γ+-cells among CD44−CD62L+/−, CD44+CD62L+ and CD44+CD62L− NKT cells were demonstrated. In (B), the percentage of CD11a+ cells among the subsets pre-defined as CD44−CD62L+/−, CD44+CD62L+ and CD44+CD62L− among total NKT cells was shown. In this figure, experiments were repeated twice. Statistical significance was displayed as ***, **, or *, if the p value is <0.001, <0.01, or <0.05, respectively. The abbreviation - n.s. - stands for “not significant” and was assigned if p ≥ 0.05.

