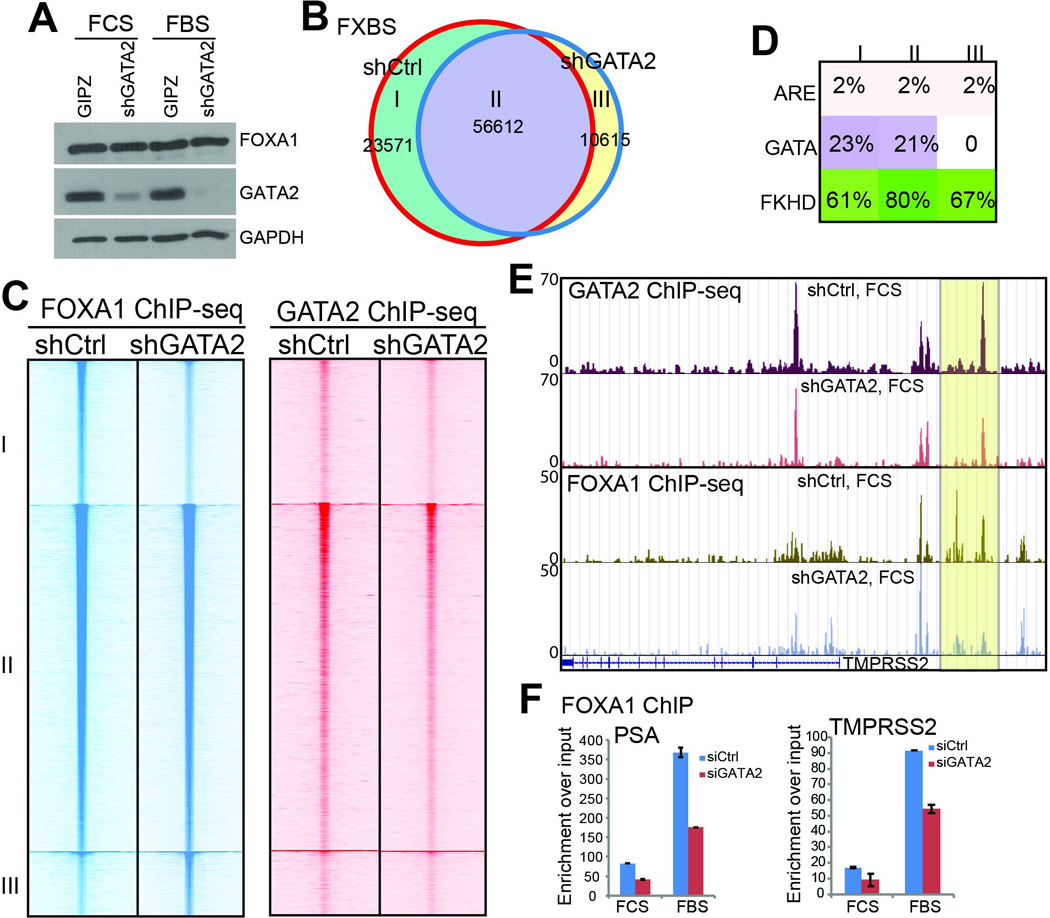
Figure 5. GATA2 is a collaborating, but not reprogramming, factor of FOXA1.

A. Western blot analysis of FOXA1 and GATA2 in control and GATA2-knockdown cells in the presence and absence of androgen.
B. Venn diagram showing overlap of FXBS identified in control and GATA2-knockdown LNCaP cells under androgen-depleted condition.
C. Heatmap view of FOXA1 and GATA2 ChIP-seq read intensity around the 3 categories of FXBS identified in B in control and GATA2-knockdown LNCaP cells.
D. Analysis of ARE, GATA, and FKHD motifs in the 3 categories of FXBS identified in B.
E. Genome browser view showing decreased GATA2 and FOXA1 binding on the TMPRSS2 enhancer following GATA2 knockdown.
F. QRT-PCR confirming decreased FOXA1 binding at the PSA and TMPRSS2 enhancers following GATA2 knockdown in LNCaP cells in the presence or absence of androgen. Data shown are mean ± SEM in triplicate qPCR and is a representative of at least two independent experiments.
