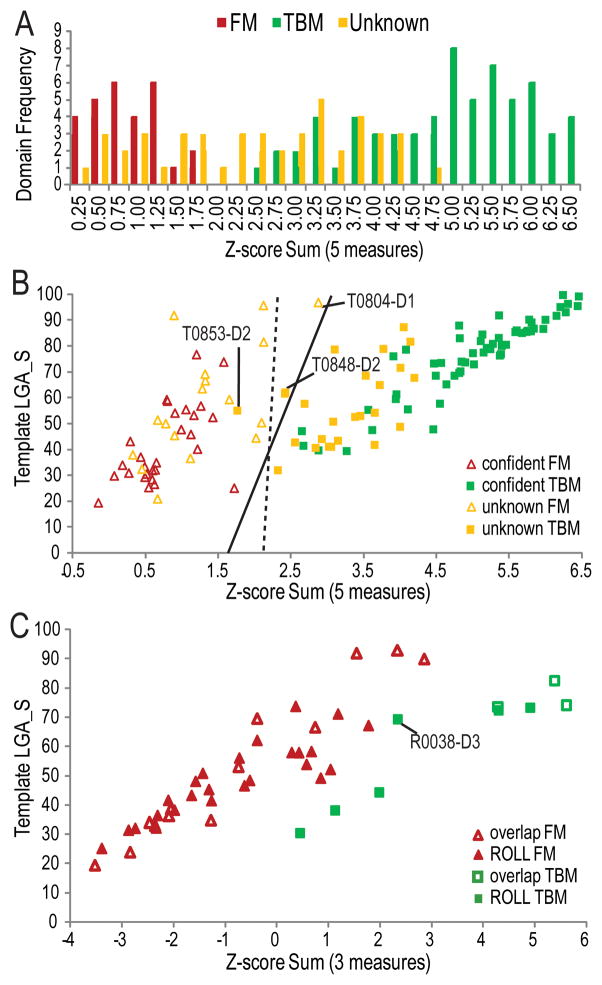
Figure 5. CASP11 target domain score distributions.
Five scores reflecting prediction quality (average GDT_TS scores of server models, average GDT_TS score of first server models above random, and number of first server models above random) and template distance (LGA_S to chosen template and HHPRED probability to homologous template) were combined as Z-score sums. A) A distribution of Z-score sum frequencies highlights the distinction (around 2.25) between confidently assigned FM (red bars) and TBM domains (green bars), with unknown domains distributed in the middle (yellow bars). B) A scatter plot of the Z-score sum vs. the template LGA_S is colored as above and highlights the final categorization into FM (empty triangles) and TBM (filled squares). An automatically defined categorization boundary using SVM with linear kernel (dashed line) differs slightly from that defined using logic regression (solid line). Target domains that blur the boundaries of categorization are labeled. C) A scatter plot of CASP ROLL targets overlapping with CASP11 FM (open markers) and targets unique to CASP ROLL (filled markers) illustrates categorization into FM (red triangles) and TBM (green squares) based on Z-score combination of measures (top first model GDT_TS, LGA_S to template, and HHPred Probability).

