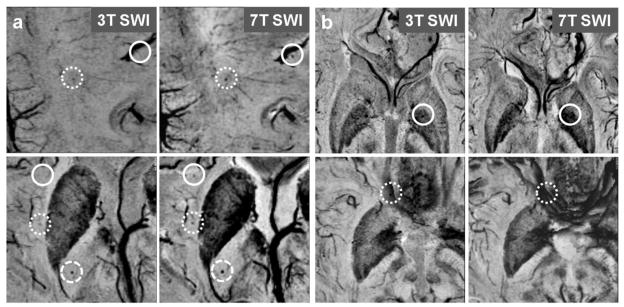
Fig 3.
(a) 3T (left column) and 7T (right column) SWI images from patient 2 (top row) and 3 (bottom row). Solid circle: CMBs seen on 7T SWI only; Densely-dashed circle: CMBs better contrasted on 7T SWI compared to 3T SWI; Loosely-dashed circle: CMBs seen on both 7T and 3T SWI. (b) 3T and 7T SWI images from patient 8 (top row) and 3 (bottom row). Solid circle: CMBs seen on 3T SWI but masked by the enhanced susceptibility effect of iron within the globus pallidus on 7T SWI; Dashed circle: CMBs seen on 3T SWI but masked by the phase wrap artifacts on 7T SWI.

