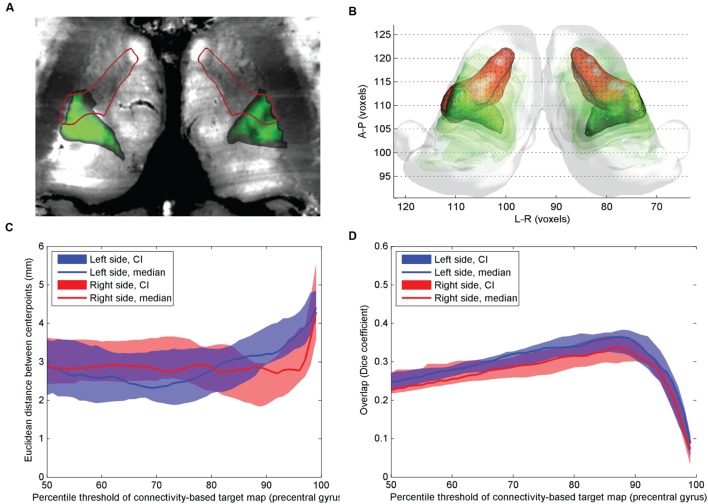
FIGURE 2.
Comparison of atlas based VLpv nucleus and CBT using precentral gyrus connections. (A) Cross-sectional image derived from histological sections, in standard space (Big Brain Atlas, Amunts et al., 2013) with VLpv overlaid (red outlines) and the CBT from the precentral gyrus (green color scale); (B) 3D visualization of the CBT and atlas targets: connectivity-based targets were visualized in green color with different opacities reflecting to the summed probability across the study population (50–95th percentile range) while the VLpv was depicted in red 3D mesh; (C) Euclidian distance of the center-of-gravity of the CBT to the atlas based target: dependency on the applied threshold values; (D) volumetric overlap with atlas based targets: dependency on the applied threshold.

