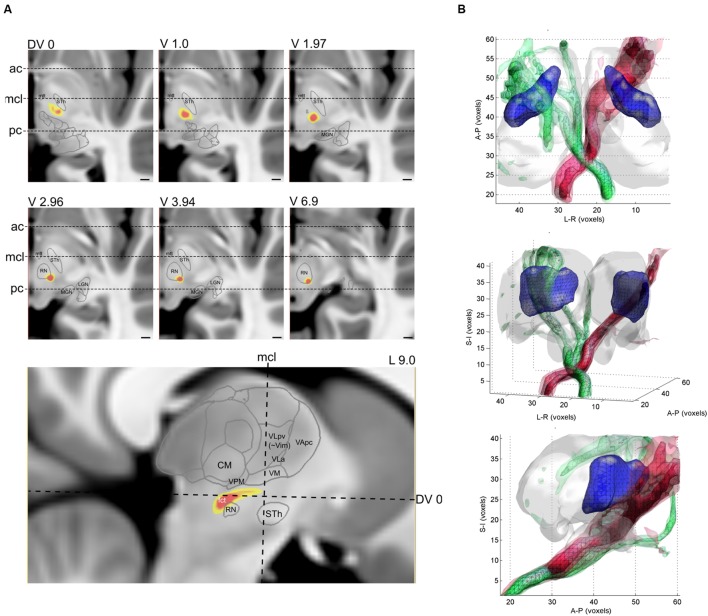
FIGURE 5.
Reconstruction of the CTT with diffusion tractography. (A) population-averaged connectivity map (yellow-red color) overlaid onto a cross-sectional image (T1-weighted MRI). Slice levels are relative to the AC-PC plane, and three major anatomical landmarks have been annotated, ac, anterior commissure, mcl, mid-commissural line, pc, posterior commissure. (B) 3D visualization of the population-averaged CTT. Different opacities correspond to the population probability from 50th percentile to 90th percentile.

