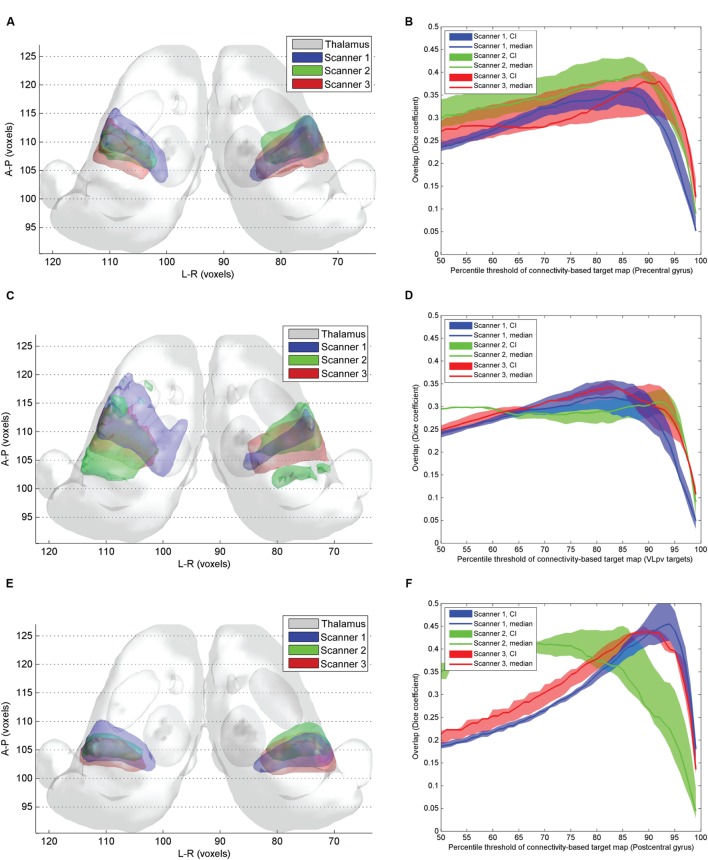
FIGURE 6.
Inter-scanner reproducibility of connectivity based intrathalamic targets. (A) 3D visualization of the inter-scanner variability of precentral CBT over the study population; (C) 3D visualization of the inter-scanner variability of VLpv CBT over the study population; (E) 3D visualization of the inter-scanner variability of VPLp CBT over the study population; (B) dependency of the inter-scanner variability of the precentral CBT volume on the applied connectivity threshold; (D) dependency of the inter-scanner variability of the VLpv CBT volume on the applied connectivity threshold; (F) dependency of the inter-scanner variability of the VPLp CBT volume on the applied connectivity threshold.

