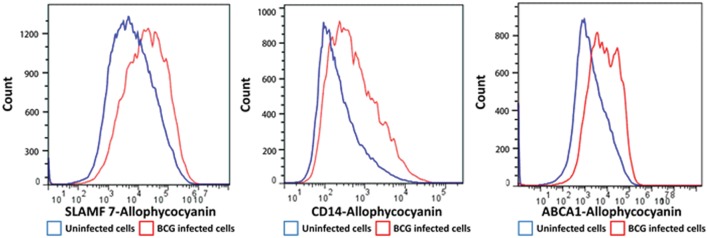
FIGURE 3.
Flow cytometry histograms of a selection of proteins with altered cell surface expression following BCG infection of THP-1 macrophages. Macrophages were infected with BCG-GFP (MOI: 5:1) for 4 h and then analyzed 48 h following infection by flow cytometry. Infected macrophages (GFPHI) and uninfected macrophages (GFPLO) were compared by mean fluorescent intensity (MFI).

