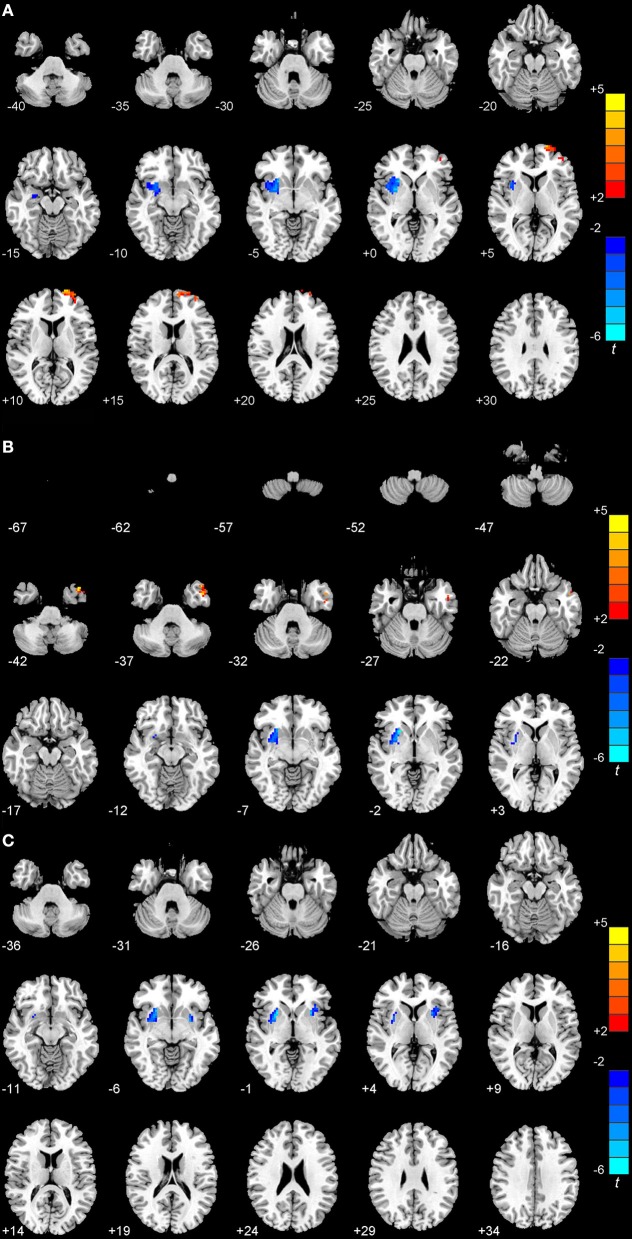
Figure 1.
Statistical maps showing the ReHo differences among patients with EOPD or LOPD and normal controls (P < 0.01, FWE corrected). (A) Compared with LOPD, EOPD showed significantly deceased ReHo values in the right putamen and increased ReHo values in the left superior frontal gyrus. (B) Compared with younger normal controls, EOPD showed significantly deceased ReHo values in the right putamen and increased in the left inferior temporal gyrus. (C) Compared with older normal controls, LOPD exhibited decreased ReHo values in the right putamen and left insula. Red and blue denote higher and lower ReHo values, respectively, and the color bars indicate the T-value from post-hoc analyses between each pair of groups.

