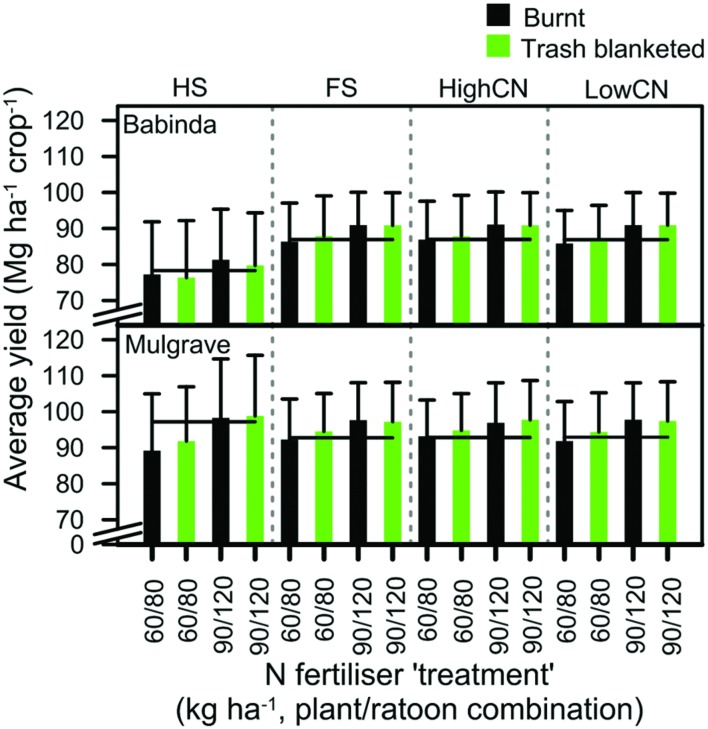
FIGURE 7.
Mean yield of burnt and trash blanketed crops in the last four crop cycles fertilized with two N fertilizer ‘treatments.’ The codes for these N fertilizer rates are shown in the legend as the combination of N fertilizer rates applied to the plant and ratoon crops: the 60/80 rate (i.e., 60 kg N ha–1 applied to the plant crop and 80 kg N ha–1 applied to the ratoon crop) and the 90/120 rate. For each location-soil combination, the value for 95% of maximum average yield is shown with a horizontal line. Error bars represent the standard deviation of the mean.

