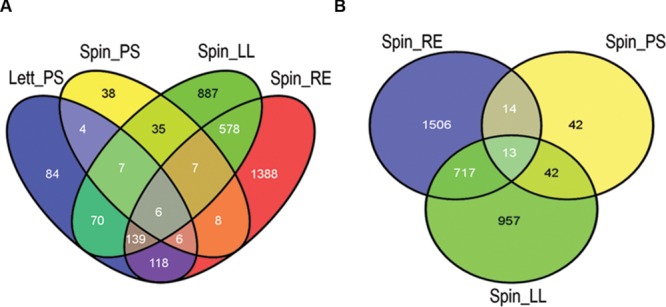
FIGURE 2.

Differentially expressed gene comparison by plant species and tissue. Overview of common and specific E. coli O157:H7 (Sakai) genes differentially expressed in plant extracts. The number of genes was compared in a Venn diagram of all four treatments (A) and for the spinach extracts only (B). Key: ‘Spin,’ spinach (S. olercera); ‘Lett,’ lettuce (L. sativa); ‘LL,’ leaf lysates; ‘RE,’ root exudates; ‘PS,’ cell wall polysaccharides (CWPSs). Images were generated using the Venny program (Oliveros, 2007).
