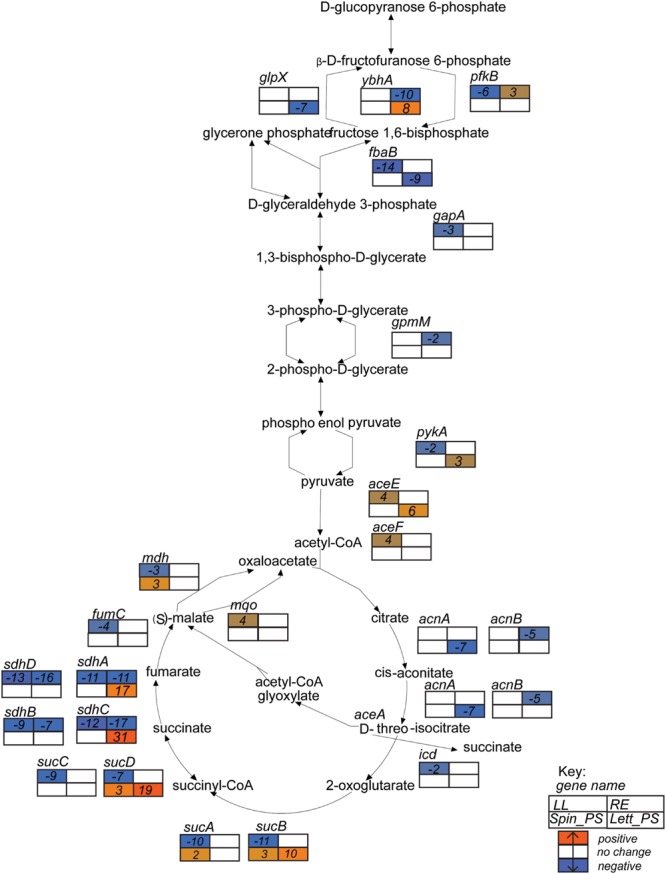
FIGURE 4.

Glycolysis superpathway gene expression profiles. Expression data for E. coli O157:H7 (Sakai) in response to different plant extracts was overlaid onto the metabolic pathway in EcoCyc (Keseler et al., 2013) to generate a color scale of expression from orange for induction to blue for repression and white for no change < ± twofold. Expression is provided for relevant genes in the pathways that were changed in at least one of the four plant conditions. Gene names are in italics and placed adjacent or close to their relevant substrates. The data for all four conditions are arranged in a grid, ordered as indicated in the Key: LL, leaf lysates and RE, root exudates for spinach; Spin_PS, spinach CWPSs; Lett_PS, lettuce CWPSs.
