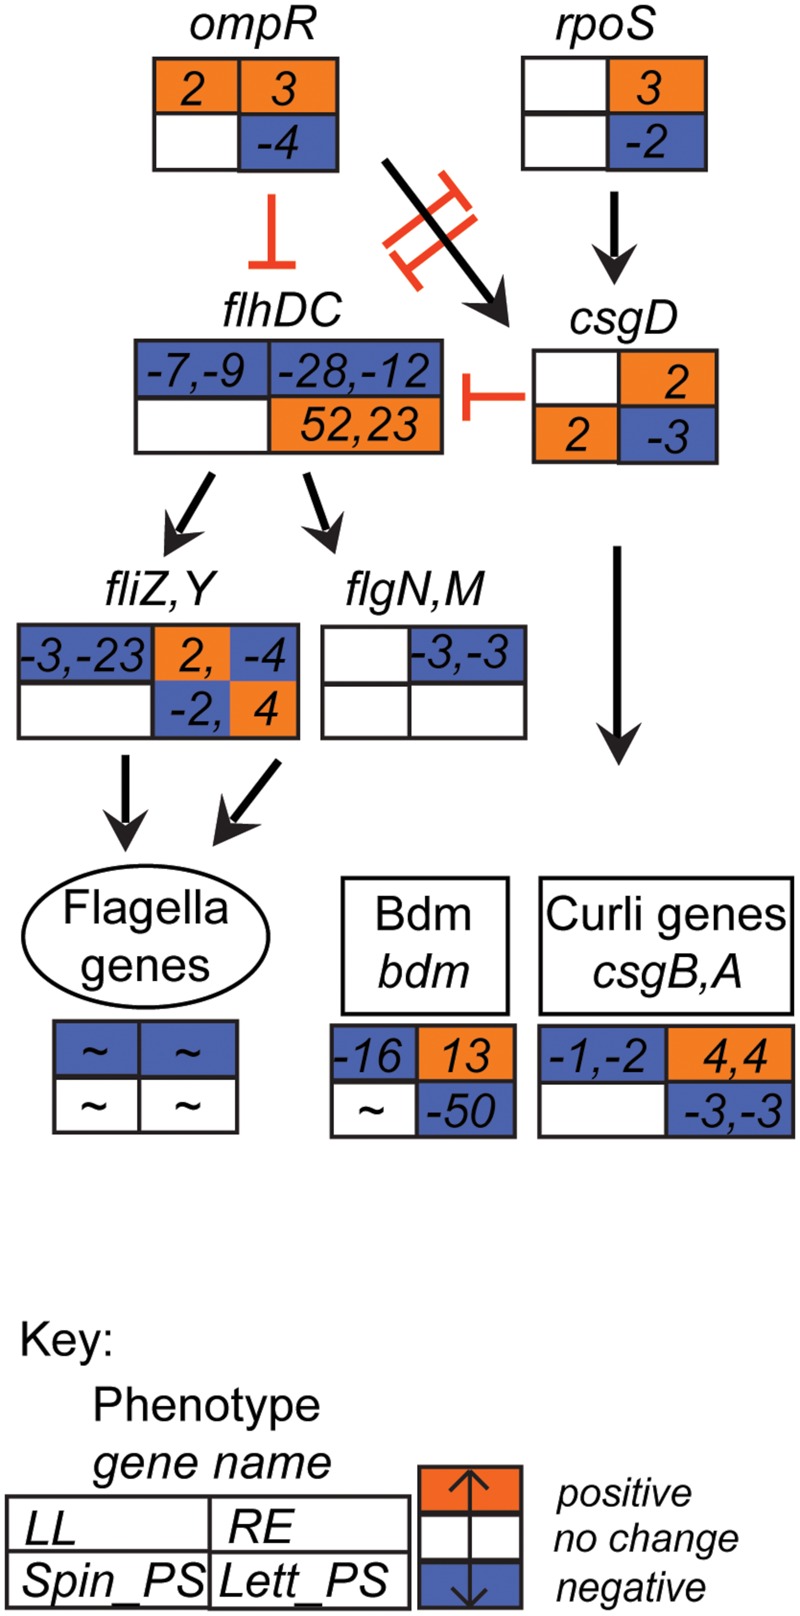
FIGURE 5.

Flagella-curli regulatory network gene expression profiles. Expression data for selected E. coli O157:H7 (Sakai) genes in response to different plant extracts was overlaid onto the network to generate a color code of expression: orange for induction, blue for repression, and white for no change < ± twofold. Expression is provided for selected genes that were affected in at least one of the four plant extracts. Gene names are in italics; genes associated with a phenotype are grouped together; an overall approximate change (indicated by ‘∼’) is provided for flagella genes (data in Supplementary Table S2B). The data for all four conditions is arranged in a grid, ordered as indicated in the Key: LL, leaf lysates and RE, root exudates for spinach; Spin_PS, spinach CWPSs; Lett_PS, lettuce CWPSs. Regulatory connections, both direct and indirect (Pesavento et al., 2008; Pesavento and Hengge, 2012; Guttenplan and Kearns, 2013), with either positive (black arrow) or inhibitory (red bar) effects are shown.
