
Figure 4.
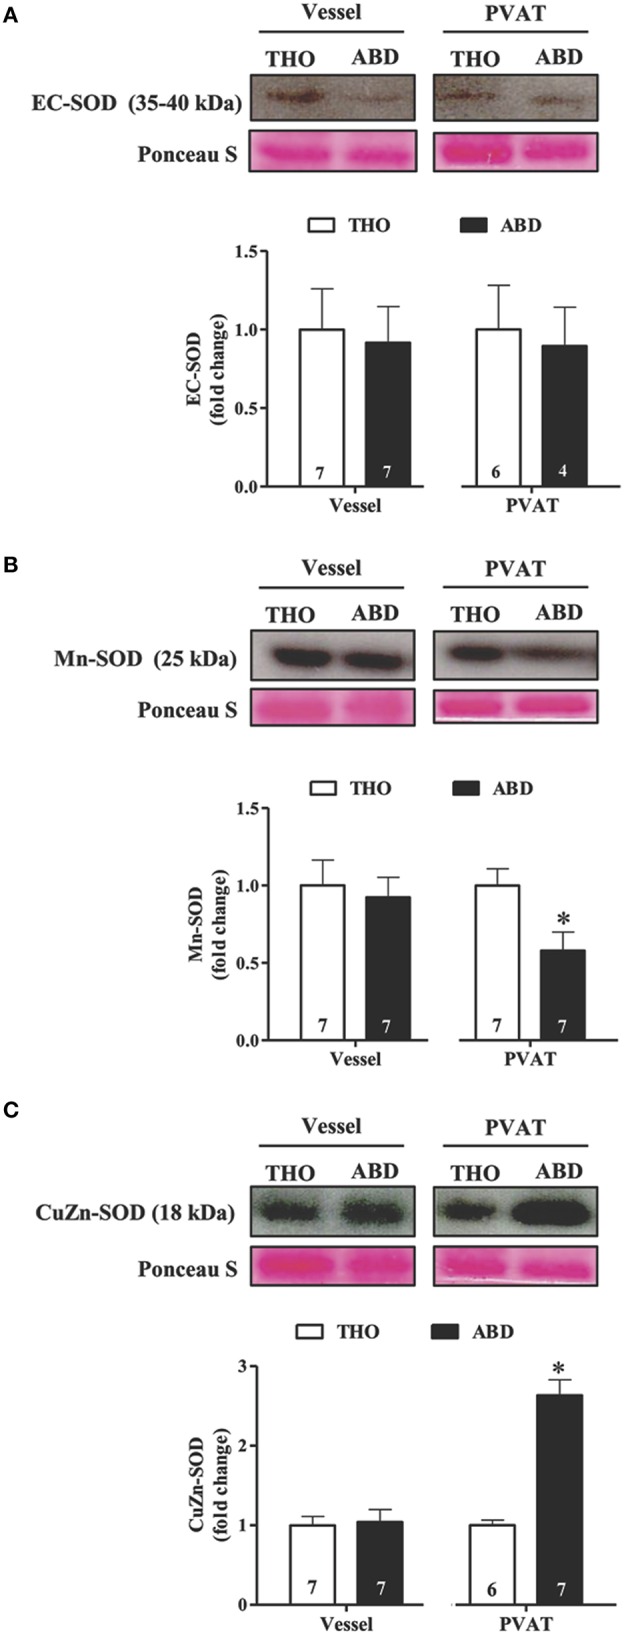
Comparative protein expression levels of superoxide dismutase (SOD) isoenzymes in thoracic (THO) and abdominal (ABD) aortic tissues. Protein expression of extracellular (EC)-SOD (A), Mn-SOD (B), and cytoplasmatic CuZn-SOD (C) in vessel walls and perivascular adipose tissue (PVAT) from THO and ABD aorta. Representative blots and Ponceau S staining were demonstrated at the upper panels of the figures and densitometric analysis is expressed as the fold change of THO expression at the bottom panel. Data are expressed as the means ± SEM; the number of animals is indicated in the bars of the graph. Student's t-test, P < 0.05: *ABD vs. THO PVAT.