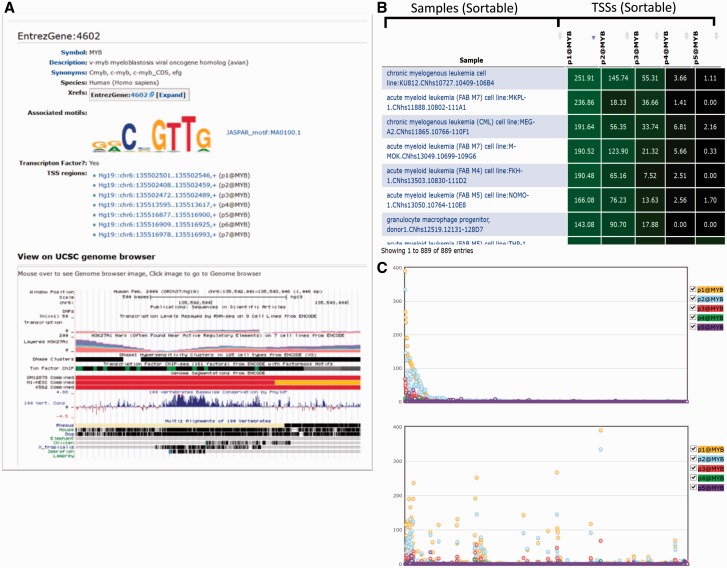
Figure 3.
Graphical representation of a gene (MYB). (A) Result of the search for MYB gene in SSTAR, with its associated Motifs and list of TSS regions. The user is able to get UCSC genome browser view of the MYB gene. (B) The table shows the expression of five TSS regions associated with MYB. (C) The graphical representation of the B) in which X-axis represents individual samples and y-axis represents expression intensities.

