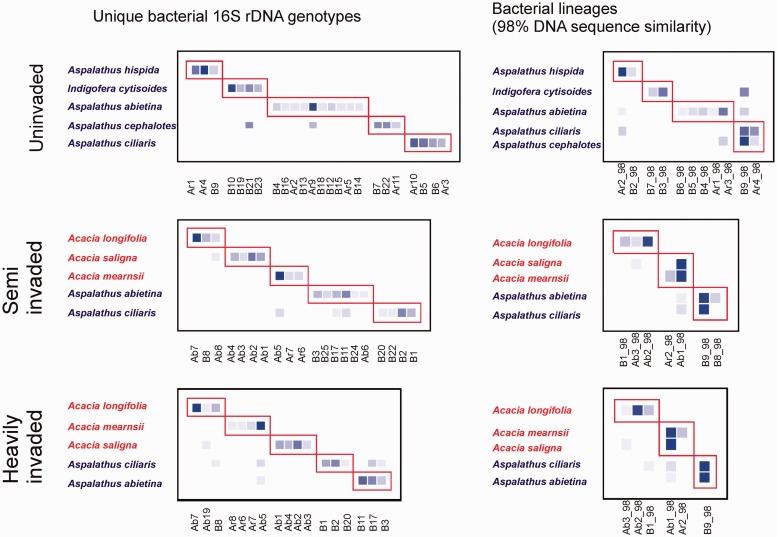
Figure 4.
Networks representing legume–rhizobium interactions across a gradient of acacia invasion (uninvaded, semi invaded and heavily invaded sites) for bacterial taxa defined as individual genotypes (see Figs. 1 and 2) and at the 98% 16S rDNA sequence similarity level. Rows represent plant taxa (red species names: invasives, blue species names: natives). Columns represent nodule associated bacterial taxa (B – beta rhizobia in the genus Burkholderia, Ar, alpha rhizobia in the Rhizobium clade (Fig. 2, clade B); Ab, alpha rhizobia in the Bradyrhizobium clade (Fig. 2, clade A)). Increasing intensity of blue represents the increasing frequency of species interactions. Red boxes represent modules identified by the weighted modularity approach of Dormann and Strauss (2014). The invasive and native plant species always occupy distinct modules.

