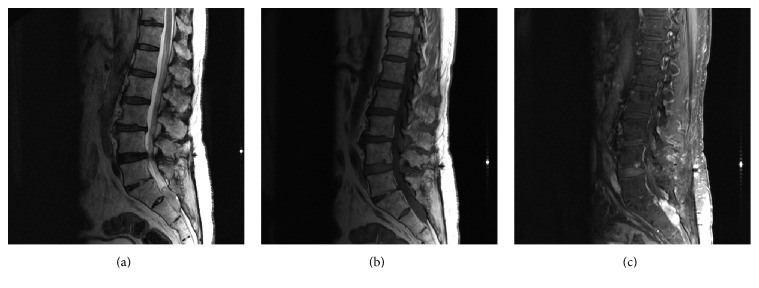
Figure 1.
MRI of the lumbar spine with and without contrast. (a) Sagittal T2, (b) sagittal T1, and (c) sagittal T1 after fat saturation: Displays a T1 isointense, T2 hyperintense contrast enhancing mass at the S1-S2 level. The mass measures approx. 3.4 × 1.2 cm without local invasion into surrounding structures.

