Figure 2.

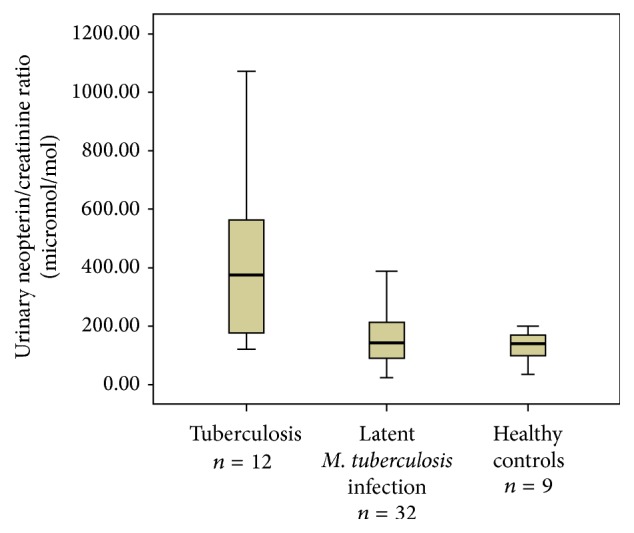
Boxplots with median (thick line within the box), interquartile range (box limits), and extremes (whiskers) of urinary neopterin/creatinine ratios in patients with active tuberculosis and latent M. tuberculosis infection and controls.

Boxplots with median (thick line within the box), interquartile range (box limits), and extremes (whiskers) of urinary neopterin/creatinine ratios in patients with active tuberculosis and latent M. tuberculosis infection and controls.