
Figure 3.
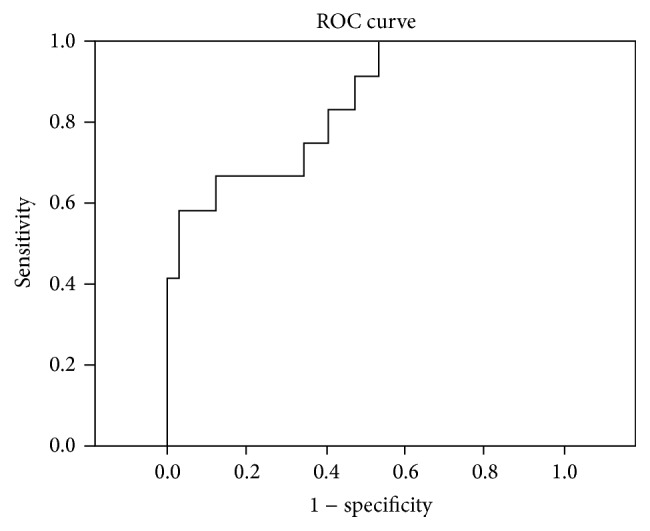
Receiver operating characteristics (ROC) curve depicting the relationship between sensitivity and specificity of urinary neopterin/creatinine ratios in detecting active tuberculosis.
Official websites use .gov
A
.gov website belongs to an official
government organization in the United States.
Secure .gov websites use HTTPS
A lock (
) or https:// means you've safely
connected to the .gov website. Share sensitive
information only on official, secure websites.
Receiver operating characteristics (ROC) curve depicting the relationship between sensitivity and specificity of urinary neopterin/creatinine ratios in detecting active tuberculosis.