
Figure 3.
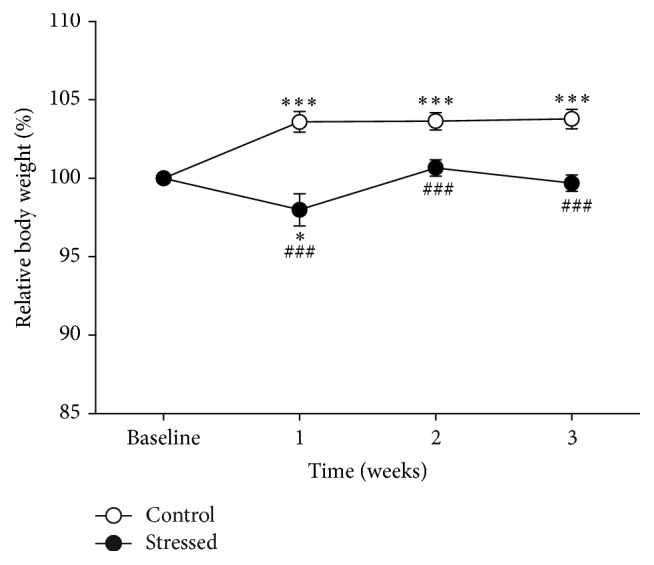
The rats' growing rate is reduced by CMS exposure. Compared to unstressed rats (white circles), the relative body weights of rats exposed to CMS (black circles) are lower at the three weeks of stress exposure. Values are expressed as percentage of baseline to avoid effects determined by baseline differences. Data are expressed as mean ± SEM. Tukey test: ∗ p < 0.05 and ∗∗∗ p < 0.001 versus baseline; ### p < 0.001 versus control group.